 XM Knowledge Base

Market Research
Create online surveys with our free online survey maker tool
Updated March 14, 2024
Whether you’re testing an idea, running a poll, or doing market research, free online survey makers help get the insights you need.
Gathering information through surveys has never been easier. There’s lots of free survey creators available – but which to pick? At Qualtrics, we offer a free survey tool with a difference.
Get started with our free survey maker
Why our free online survey maker is different
The best survey tools go beyond designing a set of questions, emailing them and then seeing your results at the end.
Successful online survey tools use the survey to gather data and add in different functionalities for analysis to find insights and take action.
Here are 11 ways that our online survey tools help:
1. A smooth survey experience
Creating online surveys (or any surveys) is simple.
Our surveys are hosted on an online platform that’s fast, intuitive and easy.
That means survey participants are more likely to complete your study, meaning you get high-quality data.
Not everyone needs to be an expert researcher to create surveys.
Look for a survey creator with a user-friendly interface that makes survey creation easy.
WYSIWYG editing and drag-and-drop functionality help you create surveys - type your question and, if you need to move it, click and drag. The options are endless.
Our survey software provides dropdown menus of different question types to ask – e.g. open text fields, matrix tables, multiple-choice, Net Promoter Score®, and even more complex ones like heat maps or pick, rank and sum.
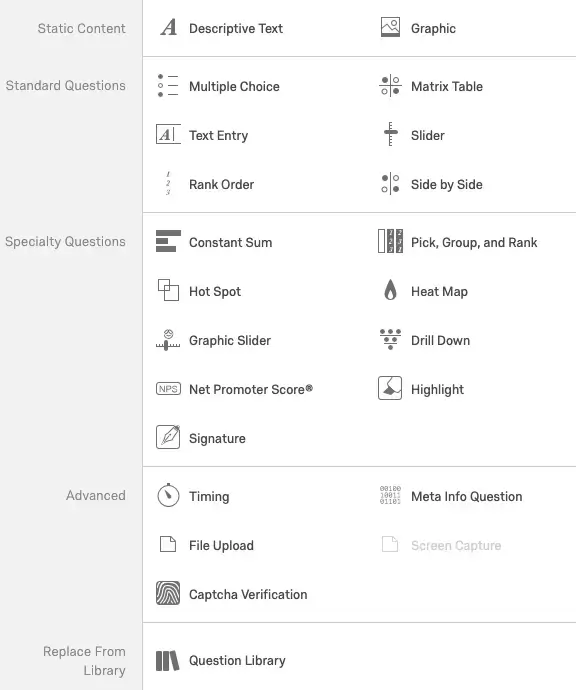
In Qualtrics, you’ll find over 200 question types (along with survey templates) with hints and tips to help you choose the right questions.
2. Customizable look and feel
If you’re sending surveys from your company - whether to customers or internally to assess employee satisfaction for example - you’ll want to customize your survey's look.
Survey platforms that include custom display settings for a menu bar, different themes, images, logos, and other flexible features enhance the response rate of the target audience for deeper insights.
Your surveys are an opportunity to reinforce your brand. Our free survey maker has a simple interface with custom themes.
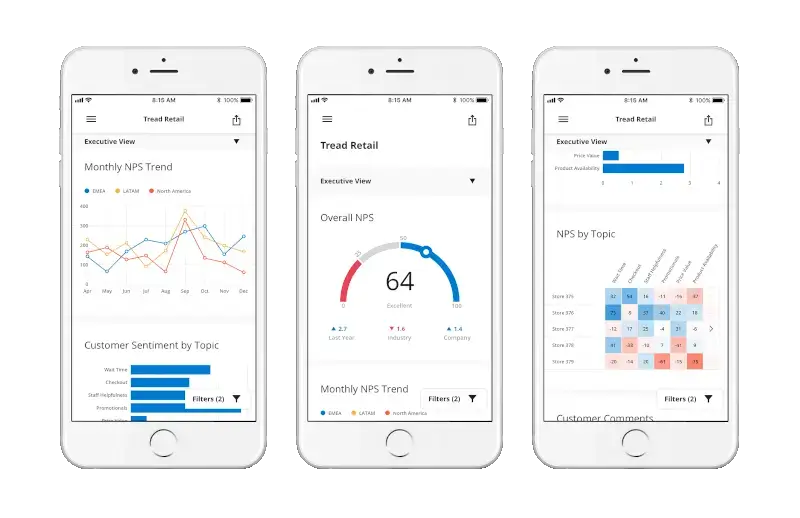
3. Dashboards and other data visualizations
Sending a survey is the start — the hard work starts when the data comes in.
Avoid survey platforms that simply present data in tables or spreadsheets — these require time and effort to interpret and, unless you’re a seasoned researcher, could lead you to miss vital insights.
2. Customizable look and feel
If you’re sending surveys from your company - whether to customers or internally to assess employee satisfaction for example - you’ll want to customize your survey's look.
Survey platforms that include custom display settings for a menu bar, different themes, images, logos, and other flexible features enhance the response rate of the target audience for deeper insights.
Your surveys are an opportunity to reinforce your brand. Our free survey maker has a simple interface with custom themes.
3. Dashboards and other data visualizations
Sending a survey is the start — the hard work starts when the data comes in.
Avoid survey platforms that simply present data in tables or spreadsheets — these require time and effort to interpret and, unless you’re a seasoned researcher, could lead you to miss vital insights.
We have analytical tools built in that perform complex statistical analysis. These include:
- Relate
- Multivariate regression
- Key driver analysis
- Predictive analysis
These statistical analysis tools are the difference between having ‘data’ and having ‘insights.’
7. Qualitative data analysis
The text analytics software within our online survey tool makes light work of text responses — automatically analyzing responses, assigning topics and sentiment scores, and automatically showing you trending topics and sentiment.
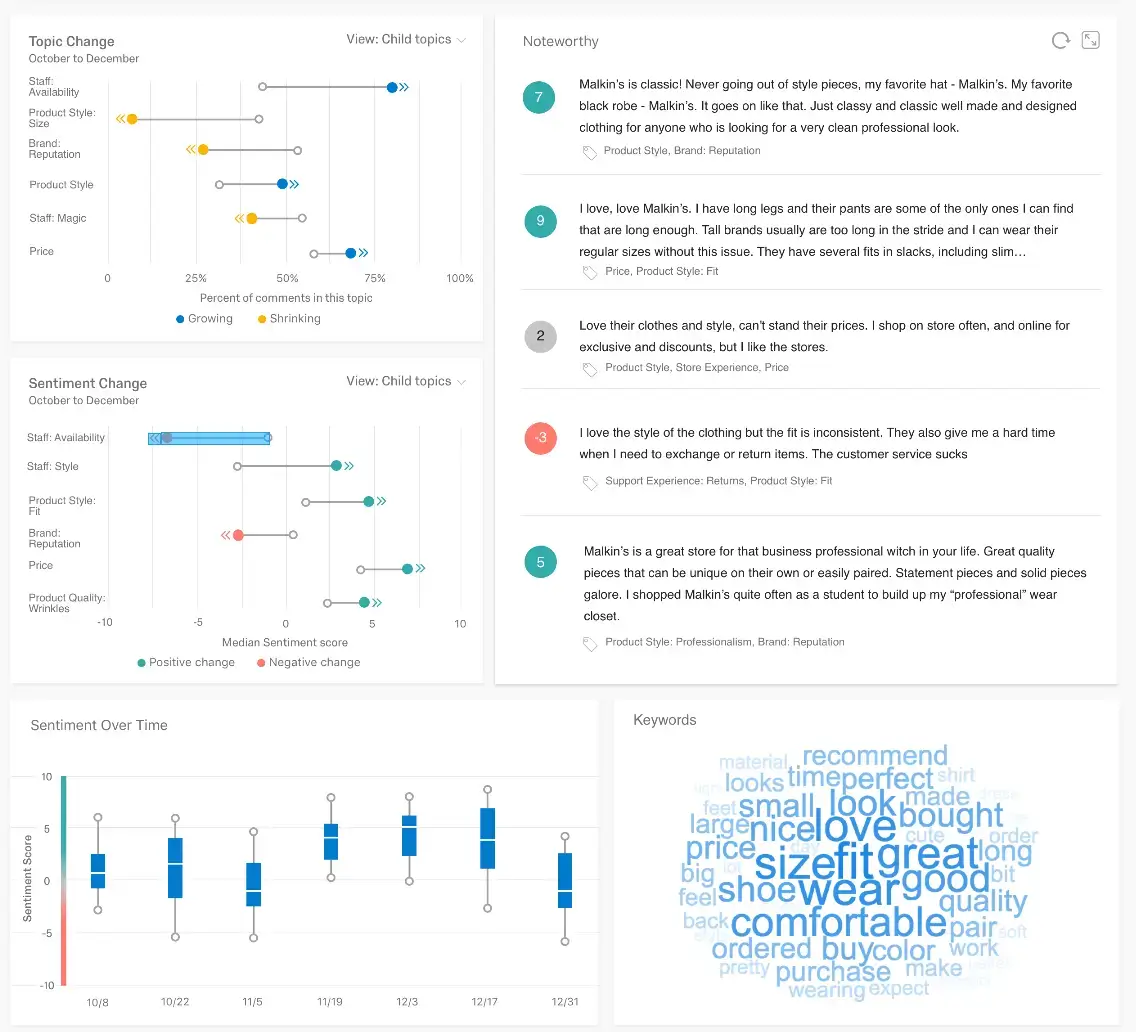
It allows you to see when topics are being talked about positively or negatively, signaling you need to investigate the cause.
With these features, more people are asking open text survey questions — generating more natural responses to get deeper insights.
It also opens the door to pull in other sources of open text feedback, such as online reviews, or social media comments.
8. Pre-built integrations
Your online survey is often part of a wider project.
Take customer experience – you may want to send out a simple customer satisfaction survey to customers.
The data you get back is incredibly useful for understanding customers’ sentiments and emotions. But by combining that data with your existing software, such as your CRM, HR systems or ERP, you can see how those experiences impact behavior.

The best online survey tools offer integrations with other systems that pass data both ways.
When someone fills out a survey, for example, their responses can be automatically sent to a customer database — it’s great not just for analyzing different data sets, but ensuring you have a single record of all interactions with people.
Qualtrics integrates into any system through an open API, offering a number of pre-built integrations including:
- Salesforce
- SAP
- Marketo
- Tableau
- ZenDesk
- Workday
- Microsoft
9. Artificial intelligence
In recent years, artificial intelligence (AI) has been at the forefront of making online survey tools more powerful.
For example, AI is now embedded into Qualtrics’ platform through Expert Review — offering proactive suggestions to improve surveys. The tool proactively spots potential issues with data protection and personally identifiable information (PII), flagging them before a survey goes live.
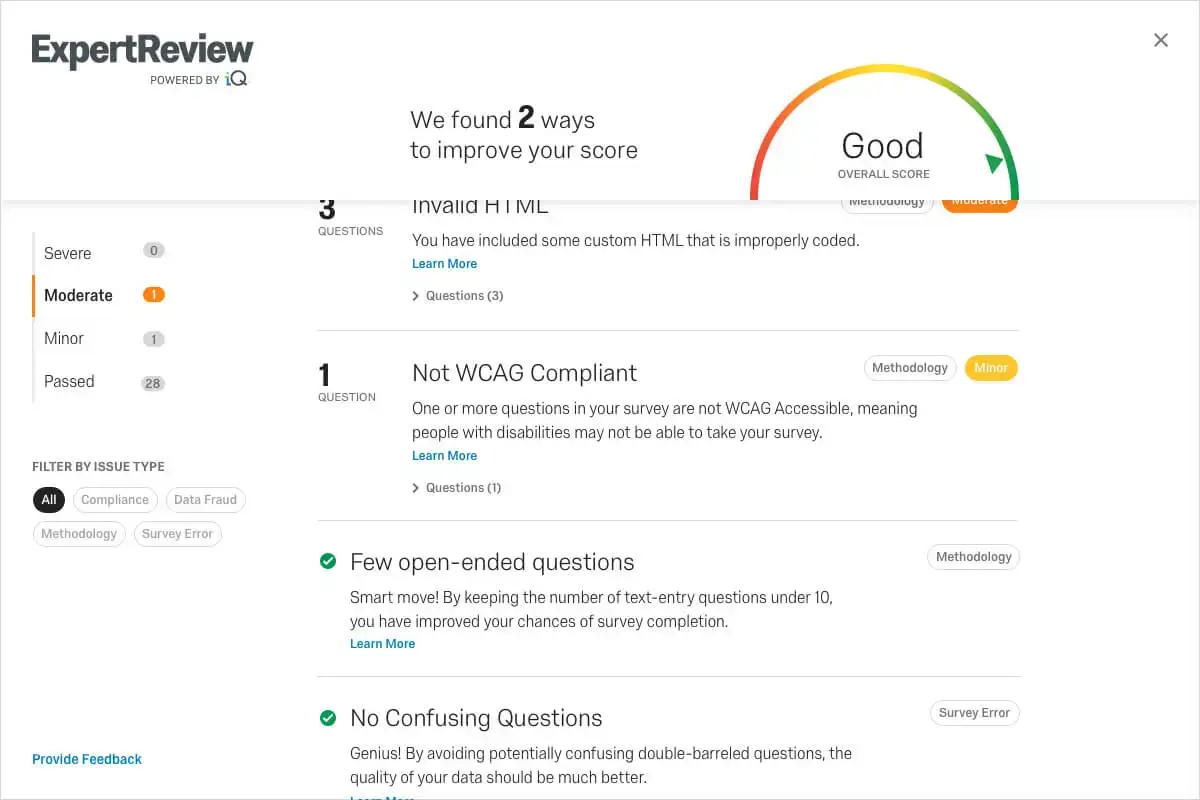
With the help of AI, the best survey platforms automate much of the data analysis too, suggesting important insights, suggesting next steps and making predictions about the future - all based on your survey data!
10. Collaboration features
Make sure the survey software makes collaboration easy, it should include features like:
- Sharing projects with a single click
- Alerts and safeguards for multiple users editing a survey in real time
- Scheduled reports and data sharing
11. Security and data protection
No assessment of a survey tool would be complete without close scrutiny of its security credentials. Whenever you deal with customer or employee data, keeping it safe and secure is paramount, with plenty of rules and regulations in different countries and some steep penalties for non-compliance.
Here are the basics to look out for:
- ISO2001 certification
- Sensitive data handling
- GDPR one-touch deletion
- User access controls
- Single Sign-On
- Data encryption in transit
- Multi-factor authentication
In some industries, there are regulations to remember like FedRAMP for the US Government or HITRUST in healthcare. Check with your survey provider that they have the right policies and certifications in place.
No matter how great your online survey tool is, before making your survey it’s worth knowing about some best practices.
Getting started: 11 steps to designing smarter surveys
Qualtrics experience management scientists know a thing or two about designing a survey flow with forms. If you don’t have a PhD (and even if you do) you can get the jump on smart, strategic survey design right here in 11 short steps.
1. Start with why
Begin by reviewing your survey objectives. What are you trying to discover? What actions will you take as a result? Understanding your goals helps you steer away from questions that don’t add value.
2. Visualize the end result
What will your final report look like? What information do you need to make a decision?
3. Rank your priorities
List your priorities, putting the most important ones first. Remember, you can’t solve the problem if you ask the wrong questions.
4. Ask yourself “how easy is it for people to provide information on each topic?”
If it’s difficult, can you change the question format? (For example, free text instead of a list of things to tick.)
- Banish bias
Bias in the survey design stage is easy to do, and skew your results. Don't provide too much information or disclose what you want the study to show. Look out for question order too – ensure earlier questions don’t bias respondents’ answers to later ones.
6. Choose question types that will deliver the best information
Use open-ended text questions, dichotomous (yes/no), multiple-choice, rank order, likert scales, matrix, or constant sum (ratio scale) questions as appropriate. (You can find out about all these and more in our Support library). Consider using our skip logic function to make certain questions only appear to those who answer a particular way.
7. Write the questions
Be sure to thoroughly think your questions through. Write several possible questions for each topic and select the best.
8. Repeat all of the previous steps to find any gaps
Having another person review your work is helpful too.
9. Check how long it takes to complete
To avoid respondent fatigue, a survey should take less than fifteen minutes. Have someone else take it with a stopwatch at the ready.
10. Pre-test the survey with 20 or more people
Assemble a group of testers and get detailed feedback. What were they unsure about? Did they have questions? Did they take a point of view not covered in your answers or questions?
11. Revise your survey, or distribute
Revise the survey if necessary and retest. Otherwise, you’re all ready to go. Distribute your survey with a single link, or invite people directly using their email addresses. Get your survey in front of the right target audience.
4 more tips from an online survey expert
Effective survey design, flow, and questions give power to your research. Continually optimize your survey until it’s right. As you go through the 11 steps above, here’s 4 more tips.
1. Keep your survey simple
Your average survey respondent can start to feel bored or tired about 15 minutes into a survey, that’s the upper-limit for most surveys.
When a survey is too long, bad things can happen:
1. Respondents drop out
They simply quit taking the survey. It costs money to find respondents, and a high drop-out rate not only costs, it can influence the quality of your results. Having a reward for completion can reduce drop-outs, but you can’t stop it completely.
2. People stop paying attention
Remember your classmate who filled in random bubbles during tests? If your survey takes too long, he might do it again. We see this a lot, and encourage researchers to use attention filters.
3. Clients get angry
The irony of upsetting customers with an overly long satisfaction survey is not lost on your respondents. The best way to collect quality data is to keep your surveys short, simple, and organized.
2. Use scale survey questions
Scales are very important.
Instead of asking yes or no questions, use question scales that measure both the direction and intensity of opinions.
Someone who “Strongly Supports” a decision is very different from someone who only “Slightly Supports” it.
Scales extend the power of analysis from basic percentages to high-level analyses based on means and variance estimates (like t-test, ANOVA, regression, and the like).
Using scales you’ll get more information.
3. Keep coded values consistent
Every survey response, option, question, or answer is coded as a numeric value, reported as a percent of responses or as a mean, median, range, etc.
These values are the basis for analysis.
Mean
The sum of all the values divided by the number of values.
Median
The middle point in a data set. To determine the median, lay out a distribution from lowest to highest and select the middle value.
Range
The highest and lowest data points in a distribution.
Values must be coded consistently. We assign the highest value to the best outcome (ie “Strongly Agree” that customer service is responsive) then move down.
Keep your scale direction consistent. This makes it easier for respondents to answer and for researchers to conduct analysis.
If scales have the same scale of points, you can quickly compare responses to different questions. For example, if a survey asks respondents to rate a series of statements from Strongly Disagree to Strongly Agree, the responses are given these values:

Standard scaling helps managers to understand customer service ratings by looking at averages.
For example, once managers understand that a 5-point agreement scale is being used, they could be given the mean results for the following customer statements:
- I am completely satisfied with the customer service — 3.15
- The customer service is prompt — 4.12
- Customer service representatives are polite — 4.67
- Customer service representatives are knowledgeable — 2.08
Since all the statements are positive, and values scaled consistently, a higher mean reflects better results in that area. A manager can look at these means and quickly identify the 2.08.
We see that customer service representatives are prompt and polite, but don’t seem to know what they’re talking about. As a result, overall satisfaction with customer service is perhaps much lower than it could be.
You can reverse scales (or word questions negatively) to encourage respondents to read more carefully.
However, if you use reversed scales or negative wording, be sure to recode the scales so they point in the same direction. This allows you to compare multiple areas of customer service. (You can do recodes easily in Qualtrics.)
The simplest solution is to keep all scales consistent.
4. Explain why respondents should help
Respondents are more likely to take your survey if there’s value for them.
Offerings can range from a general appeal for help to a specific offer of money. For instance, with a customer feedback survey, you can explain that feedback will improve customer service.
Here’s some quick examples:
1. Make it specific to them
With employee evaluations, you can explain that feedback will be used to determine awards, promotions, and pay raises and will help management make organizational decisions that will affect them.
2. Explain unexpected questions
For instance, if it’s important for you to ask toy store customers their preferred jeans color, you should explain why that’s relevant.
3. Justify requests for sensitive information
Explain that purchasing habits will only be analyzed in aggregate for benchmarking purposes or survey results will not be shared outside your organization.
Launch expert-designed surveys in seconds with Qualtrics Survey Tool
While flexibility and freedom to create an online survey are pillars of Qualtrics Surveys, not everyone has the time, or expertise, to create best practice surveys.
That’s why we’ve included pre built survey templates in Qualtrics Surveys. When you open your free online survey, you’ll find over 50 easily editable templates, ready to go.
Or read below for a quick intro:
Marketing
- Brand Awareness & Performance
- Creative & A/B Testing
- Customer Satisfaction (CSAT)
- Demographic Polls
- Event Signup, Planning & Feedback
- Store & Online Purchase Feedback
Product
- Early Access Feedback
- New Product Idea
- Pricing Study
- Product Naming & Package Testing
- Product Satisfaction
- And more
Business Operations
- Employee Suggestion box
- Employee Exit Interview
- Employee Engagement
- New Hire Onboarding
- Interview Feedback
- Manager Feedback
- IT Help Desk
Academic
- Faculty Satisfaction
- Informed Consent Form
- Student Recruitment
- Student Satisfaction
- Quick Poll
Support if you need it
We offer world-class support in the form of online tutorials, free tools, how-to articles and downloadable survey templates that work seamlessly with your Qualtrics free account (click here for more info). If you get stuck, explore our content library, or reach out.
Get started with free surveys today