How to track candidate flow with Workable


A healthy recruiting process requires a healthy flow of candidates. ‘Candidate flow’ refers to the number of candidates that enter your talent pipeline over a given time period. For example, after posting a job ad, you may receive 200 applications during the first week, 50 during the second week and 10 during the third week. In this case, your candidate flow is higher during the first week than the following two weeks combined.
Tracking candidate flow is useful because it helps you spot patterns in your hiring. For example, your candidate flow might peak in January and September. Or you may notice that candidate flow is higher during weekends. Depending on what patterns you detect with your candidate pipeline, you can use this information to:
- Determine how to spend your recruiting budget. Imagine your candidate flow is usually low in February, meaning that most people aren’t looking for a job or a new opportunity. In that case, consider spending more money on sourcing that month instead of on job ads to get more candidates.
- Choose the best day to post your job ads. For example, if candidate flow is usually high during weekends, advertise your jobs on Friday to improve your chances of getting applications fast.
- Decide when to pay for job ads. Suppose candidate flow is usually low during the beginning of a month. In this case, paying for premium job posting can maximize visibility of your ad to attract as many candidates as possible. Or, you may decide to put off posting your job until a time when candidate flow is normally high.
- Re-adjust your recruiting efforts. For example, assume your pipeline has a healthy flow of candidates for the first few weeks your job is live. If your candidate flow slackens, and you still haven’t found your best candidate, you might need to source candidates, re-advertise or ask for referrals.
Looking for better reporting analytics? Workable’s reports will refine your recruiting process. Request a demo to learn more today.
Why should I use Workable to track my candidate pipeline?
The traditional alternative to recruiting software is spreadsheets. If you are using them to record candidate names and the dates they applied, you can sort the columns according to months, days or other periods to see your candidate flow. But, as with all tasks that require manual data entry, this approach may result in:
- Mistakes and inaccurate data.
- Lost time whenever you need to sort new data.
With Workable, you can see candidate flow at any given moment with the click of a button. The system automatically records who enters your candidate pipeline when and creates comprehensive reports, including a report on candidate flow.
What does Workable’s Candidate Flow Report look like?
Workable’s Candidate Flow Report shows the number of candidates who entered your hiring pipeline over a given time period, as well as how many of those candidates made it past the first screening stage. This view will show when:
- You get the most candidates
- The best qualified candidates apply
When you’re logged in to Workable, access the ‘Reports’ page easily by clicking the pie chart icon in the main menu bar and selecting the Candidate Flow Report.
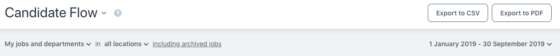
Then, you can set report parameters, like selecting a time frame and choosing a particular job or department. You can also generate reports for all active or inactive jobs.
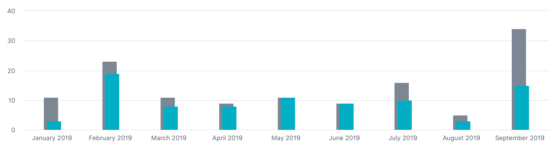
Once you have set parameters for your report, it will be displayed in-page below. Inspect the bar charts at the top of the page. They provide a quick visual breakdown of the number of candidates who have passed the first screening:
- The grey bar shows the total number of candidates who applied or were sourced during the given time period.
- The blue bar shows the number of candidates who moved forward from the first screening.
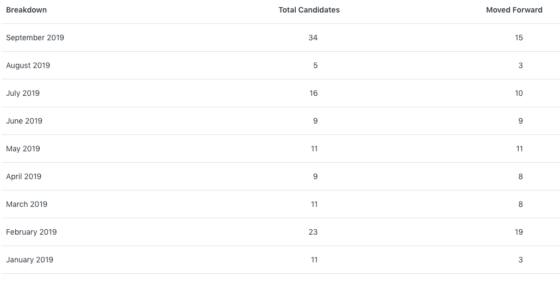
If you want to dig deeper into the data, study the table underneath the bar chart. You’ll see a breakdown of the total number of candidates who entered your pipeline and those who have moved forward from the initial screening stage.
To get a well-rounded view of your hiring, combine your candidate flow analysis with other reports in Workable’s reporting suite. From time to hire and productivity to candidate sources and referrals, Workable’s reports will help you discover patterns or issues in your hiring and find ways to increase efficiency and quality of hire.