 XM Knowledge Base

Customer Experience
The 2021 Qualtrics Digital CX Benchmark
The Qualtrics XM Institute is excited to announce the third annual, 2021 edition of our digital benchmark initiative - the XMI Customer Ratings - Digital.
These benchmarks are timely as we have all witnessed the explosive growth in digital and digital transformation efforts across industry verticals in the past 2 years. And in an uncertain world, there has been great clarity around the importance of the digital experience. According to McKinsey, companies made the equivalent of 7 years of progress with their digital transformation efforts in 2020 alone.
To further iterate this point, we know that in 2019 , 85% of firms viewed digital as a “nice to have'' (Forrester), now it’s a “must have”. There’s no doubt that this is no longer the case - 2020 and the pandemic permanently changed the landscape and digital is front and center.
With these trends in mind, we created an index score to help brands quickly assess how they compare to their peers with a straight-forward, yet meaningful metric that provides a useful snapshot of the digital experience.
To generate the ratings for 216 organizations across 20 industries, we asked consumers to rate their recent website experiences and evaluate three components described below.
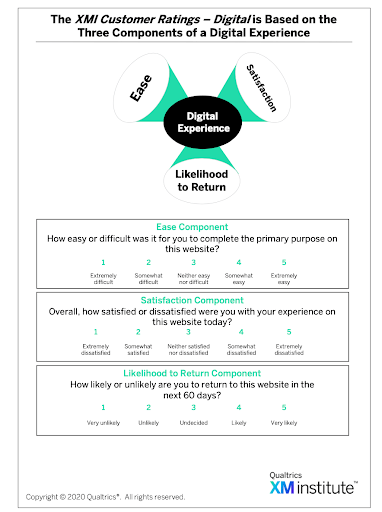
How the ratings are calculated
There are three core components of the XMI - Digital Rating Score: Ease, Satisfaction, and Likelihood to Return. This score was calculated in the following way:
- For each of the three separate components, we look at the percentage of consumers who gave the company a high score (“4” or “5” on our set of 5-point scales) and the percentage who gave the company a low score (“1” or “2”).
- Within each individual component, we subtract the percentage of low scores from the percentage of high scores. This results in three separate ratings. Each rating is an index score with a range of -100% to 100%.
- Finally, we average these three component scores (ease, satisfaction, and likelihood to return) for each company to generate that firm’s XMI Customer Rating - Digital Score.
How to display benchmarks in your dashboard
To access the full report and get the latest data up and running in your dashboard, please contact your Customer Success Manager.
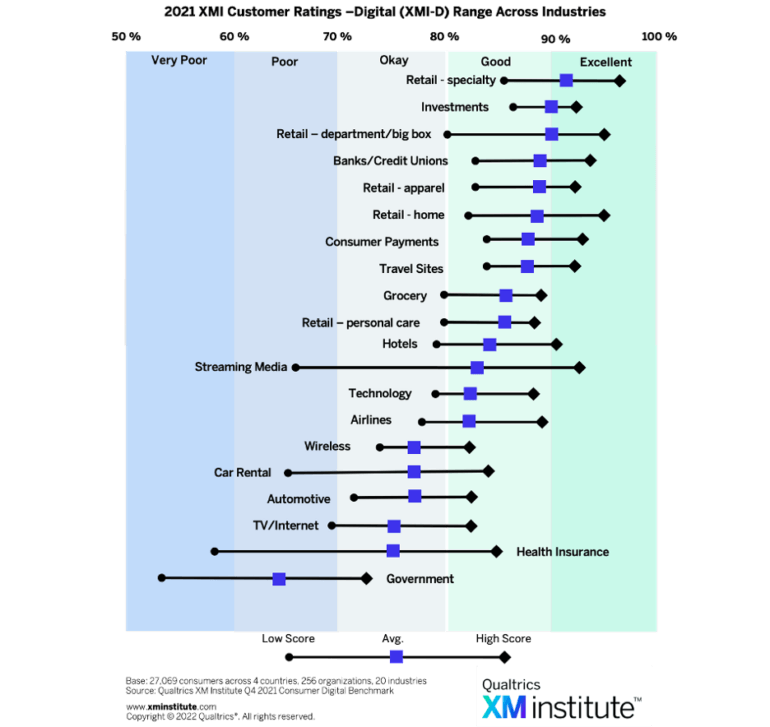
Standout findings for the XMI Customer Ratings - Digital report
Here are some of the 2021 key findings by specific industries, and some of the key changes from the previous year.
- Three industries averaged “excellent” ratings. The specialty retail industry topped the list with an average rating of 91%. Meanwhile, the grocery and consumer payments industries slipped from a rating of excellent last year to a rating of good this year.
- Most industries averaged “good” ratings. The majority of industries averaged “good” ratings, between 80% and 90%. In particular, the department/big box and home retail industries were both at the highest end of the ”good” range, with an average score of 89% each.
- Government agencies earned the lowest ratings. Government was the only industry to receive a “poor” rating, receiving the lowest average score of 68%, and a government agency earned lowest overall organizational score of 54%. Government was also the lowest performing vertical in 2020.
- U.S. Consumers provided the best evaluations for ease. Of the three components, ease earned the highest average score in 19 of 20 US industries. Likelihood to return lags behind, earning the lowest average scores of the components across all US industries.
Industries include: Airlines, Automotive, Banks/Credit Unions, Car Rental, Consumer Payments, Government/Federal Agencies, Groceries, Health Insurance, Hotels, Investment Firms, Apparel Retail, Big Box Retail, Home Goods Retail, Personal Care Retail, Specialty Retail, Streaming Media, Technology, Travel Sites, TV/Internet Service Providers, Wireless.
How to use the ratings in your own program
So here are five ways to leverage the new XMI Customer Ratings - Digital....
- Start measuring. The first step in Experience Measurement is knowing where you stand. If you haven’t yet, start gathering feedback on your websites and apps right away.
- Use a methodology. Measure ease, satisfaction, and likelihood to return for your sites and apps. Roll these core metrics up into your own Digital XMI. All of these metrics map onto our industry-based Digital XM Solution content.
- Make note of the three pieces. It can be quite useful to have a “score,” but it’s still important to take a look at these core metrics individually. CSAT is great at measuring a unique digital transaction, ease of use speaks to customer expectations when it comes to simple UX design, and likelihood to return sheds light on the creation of a loyal customer. Check out the figure below for more specifics.
- Create a system of action. Once you have a sense of how your data is trending, it’s essential you then act on it. Unfortunately, most organizations that collect customer feedback do not actually follow up in a meaningful way. Leverage digital connectivity, integrations, and real-time work flows to close the loop where relevant.
- Compare apples to apples. Like most benchmarks, ours are gathered through a blinded survey drawing on market research panel, but your respondents are coming from your customers in a branded request for feedback. Be thoughtful about how you apply all benchmarks as you measure your failures and successes.
Learn to create a powerful CX program that drives impact.
Improve your digital cx with our ebook: The Digital Experience Playbook