
Every month, we share our thoughts on the state of Main Street amid the global pandemic. With information from over 60,000 businesses and one million active hourly employees, our data offers insight into how the US small business economy is faring and what we might expect in the coming months ahead.
You can find the full report here, but here’s a snapshot of what we saw in October.
How did Main Street fare in October (30-second snapshot)
Looking at our Main Street economic indicators indexed against our January baseline, our metrics continued to remain flat in October, with 20% of small businesses still closed.
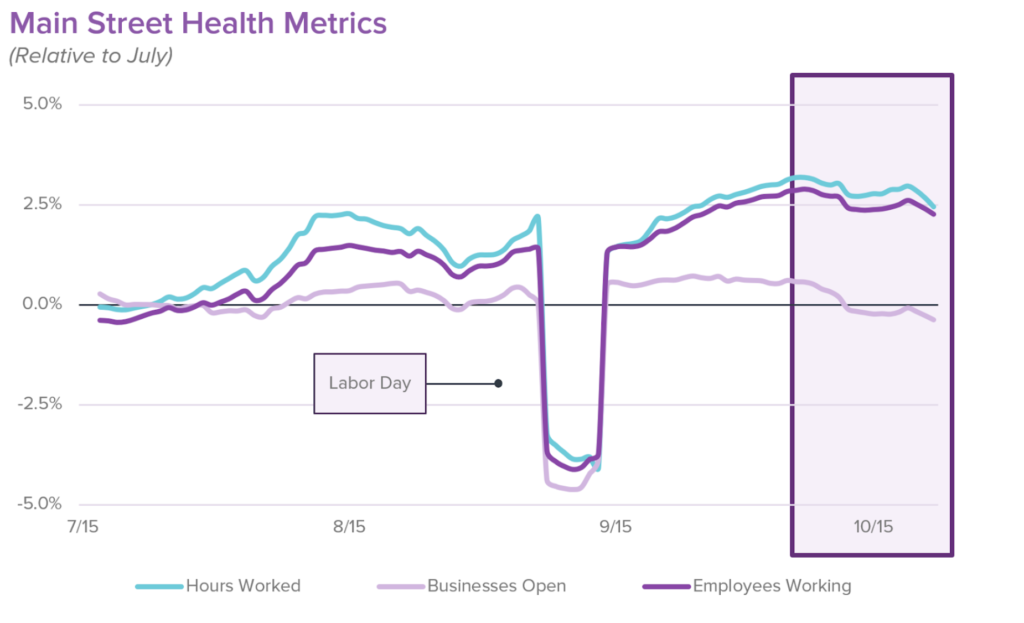
However, after re-indexing our metrics to a more recent baseline (July) to zoom in on how small businesses have fared amid the pandemic, we saw our Main Street indicators decline in the two most recent weeks of October.
From a geographic perspective, states in northern regions of the US with cooler climates saw steeper declines, especially those that simultaneously saw spikes in COVID cases accompanying their falling temperatures.
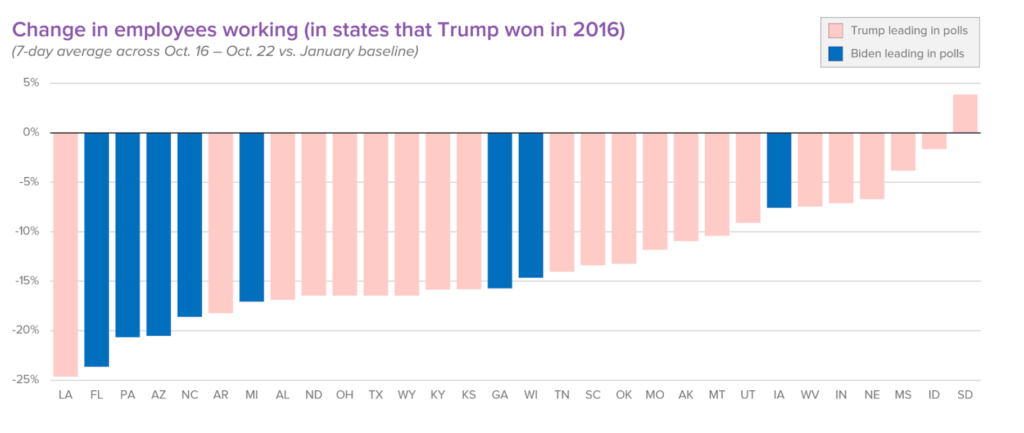
Lastly, given that the election is just days away, we wanted to take a look at how states that have been more impacted by COVID are currently polling. In the latest polls, 8 of the 30 states that Trump won in 2016 now have Biden leading. It seems that states that have been more impacted by COVID, as told by our metrics, are more likely to lean toward Biden.
Another month of stagnation
When looking at our Main Street metrics benchmarked against our January baseline, our economic indicators continue to look flat.
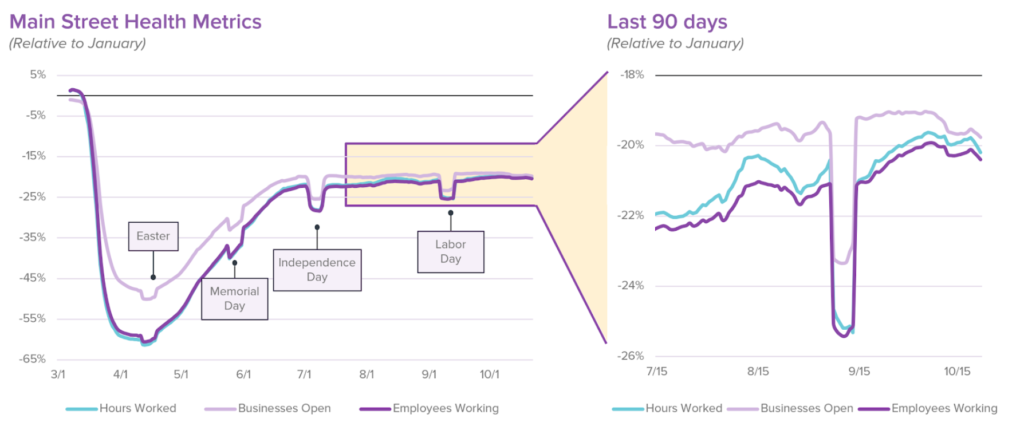
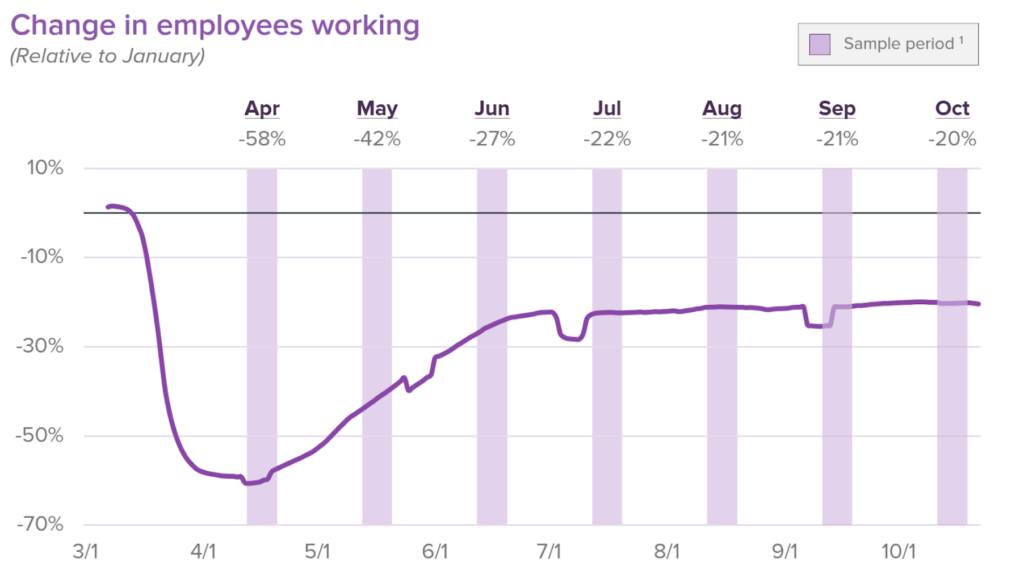
Looking at employment, our October reference period of calendar week 10/11 saw a 1 percentage point improvement vs. our September reference period (9/8 – 9/14, to exclude Labor Day), a marginal improvement. Looking at the following week in October, our employees working metric was flat vs. September (-21% for week of 10/18 – 10/24), pointing to yet another month of stagnation.
Declines in October become clearer with our new data set
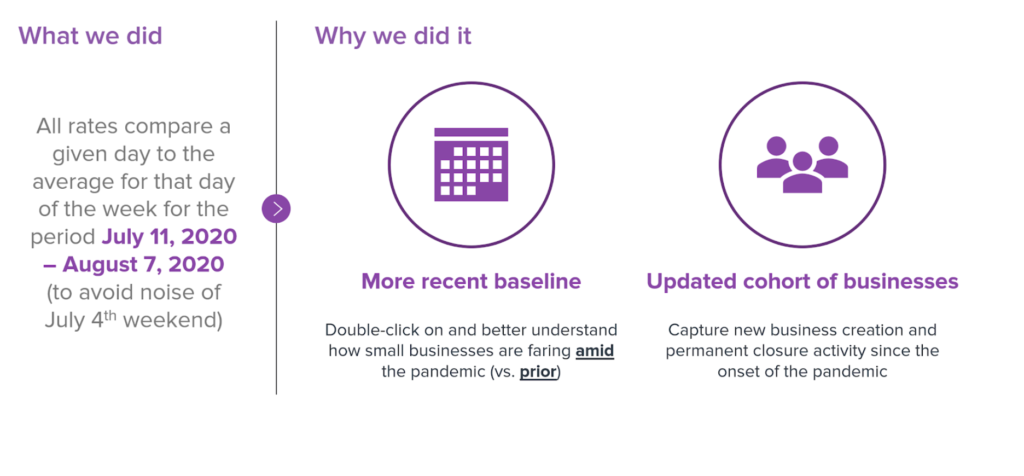
For the last few months, we’ve been evaluating our metrics through the lens of a pre-COVID perspective since we wanted to see how small businesses are tracking against their pre-COVID levels. As we get further away from January 2020, we wanted to develop a “fresher” benchmark to double-click on how the small business economy is faring amid the pandemic (vs. prior to the pandemic onset).
By reindexing our metrics from a January baseline to one in July, we’re able to refresh the cohort of companies that we evaluate by capturing new businesses that have signed up for Homebase since January and filtering out businesses that may have permanently closed from the pandemic.
With this data set, a more nuanced perspective emerges: while our January data set indicates flat activity since late June, our July data set indicates a more pronounced recovery in the summer months of July, August, and early September, and more clearly shows a decline across our three metrics beginning in the first week of October.
Regions with cooler climates saw steeper declines
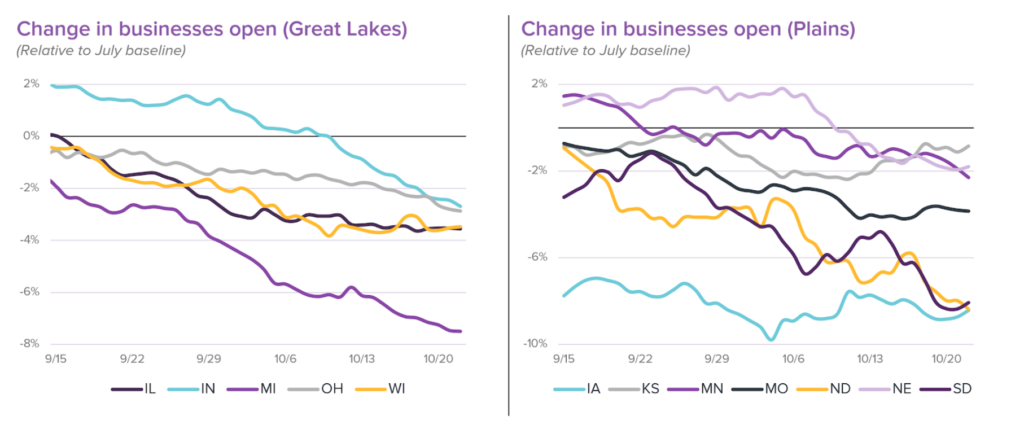
Leveraging this new July data set, we then double-clicked on the various regions of the US to see if there were any discrepancies between how different regions fared in October.
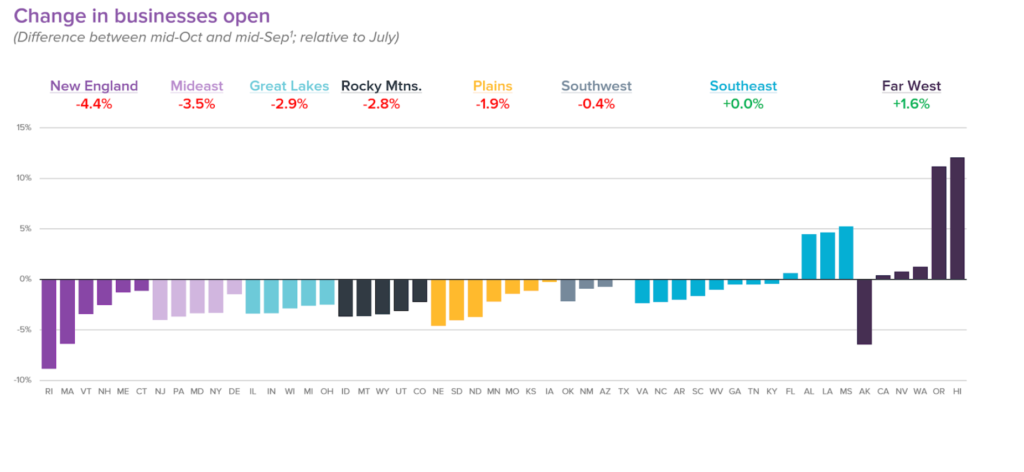
From this, a clear dichotomy emerged between regions in the northern and southern halves of the US. While New England, the Mideast, the Great Lakes, the Rocky Mountains, and the Plains all saw declines in businesses open in October vs. September levels, regions in warmer climates like the Southwest, Southeast, and Far West saw more mild impacts, and in some cases, even improvements vs. September levels.
As further evidence that weather may be indicative of how small businesses are performing, take a look at the Far West. While Alaska is grouped within this region by the US Bureau of Economic Analysis, it’s clear that because Alaska sits in a colder climate than Hawaii, California, and the rest in this group, it saw a much sharper decline in the number of businesses open.
Another view at states, but through the lens of the election
With the general election just days away, we were curious to see if any patterns emerged between how states are currently polling and how they’ve been impacted by COVID-19.
While all 20 of the states that Clinton won in 2016 are likely to vote blue once again this year, 8 of the 30 states that Trump won in 2016 have Biden leading in their polls, according to FireThirtyEight. When we look at these 30 states through the lens of our metrics, it seemed that states that have been more impacted by the pandemic (FL, PA, AZ, NC, MI) are now more likely to lean toward Biden.
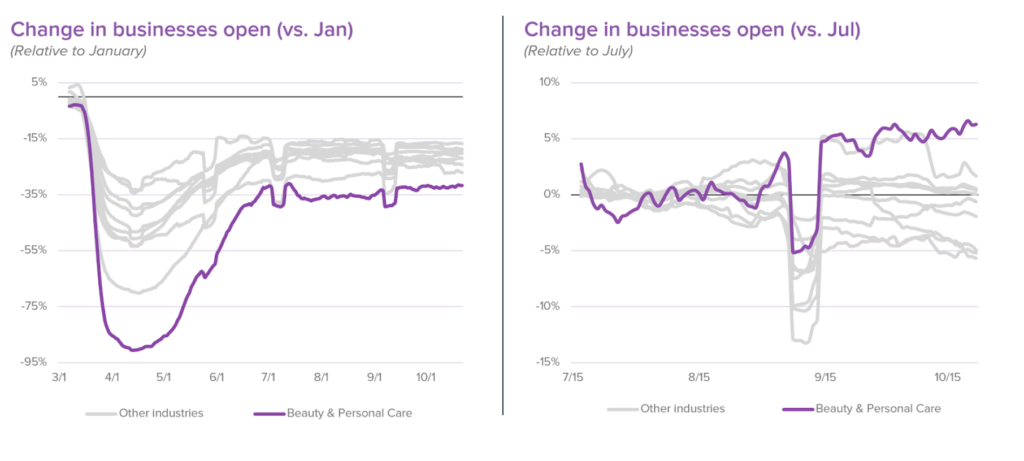
Industry perspectives: a good month for beauty & personal care, and woes for food & drink
First, we took a look at which industry fared best this past month. While the beauty & personal care sector has been most impacted by the pandemic out of all of the industries we track, it also fared the best this past month as salons, spas, and nail parlors reopened nationwide.
Last month, we were concerned that the end of summer would adversely affect the food & drink sector as outdoor dining becomes more challenging with cooler weather. Interestingly enough, from a national perspective, it looks like the sector was relatively flat this past month vs. September levels.
However, when looking at states in regions that experienced recent flare-ups in COVID cases, we saw that food & drink businesses were adversely impacted.
How has Homebase data been validated?
We’ve partnered with a number of academics, researchers, and policy makers to validate and improve our data. Here are a few examples:
- The St. Louis Federal Reserve suggested that Homebase data could be predictive of the jobs reports
- Researchers at Drexel used Homebase data to estimate the “true” employment level
- A team at UChicago and Berkeley used Homebase data to show disparate impacts across different groups
Methodology and definitions
The January dataset is based on Homebase data gathered from over 60,000 businesses and 1 million hourly employees active in the US in January 2020. All the rates compare that day vs. the average for that day of the week for the period Jan 4, 2020 – Jan 31, 2020. The July dataset does the same, except it looks at the period July 11, 2020 – August 7, 2020.
- “Hours worked” is calculated from hours recorded in Homebase timecards
- “Locations open” is based on whether a business had at least one employee clock-in
- “Employees working” is based on the distinct number of hourly workers with at least one clock-in
Questions or comments about our findings?
Contact Ray Sandza (VP, Data & Analytics) and Kevin Liang (Manager, Data Products) to learn more about our findings and our data.
Homebase makes work easier for 100,000+ small (but mighty) businesses with everything they need to manage an hourly team: employee scheduling, time clocks, team communication, hiring, onboarding, and compliance. We are not Human Capital Management. We are not HR Software. We’re tools built for the busiest businesses, so owners and employees can spend less time on paperwork and more time on what matters.

Remember: This is not legal advice. If you have questions about your particular situation, please consult a lawyer, CPA, or other appropriate professional advisor or agency.