The HR Daily Advisor research team conducted the 2016 Talent and Performance Management Survey in January, 2016. Talent and performance management are some of the most important and rigorous tasks any HR professional has to deal with. We asked participants everything from how they identify high-performing employees to how they reward those employees to what survey participants think about performance appraisals in general.
Highlights of the Talent and Performance Management Survey:
- When survey takers were asked if they expect to face shortages of talent in areas that will impact their productivity or success in 2016, the majority (71.4%) answered “Yes.”
- When asked where shortages were likely to occur, 40.1% of participants answered, “management.”
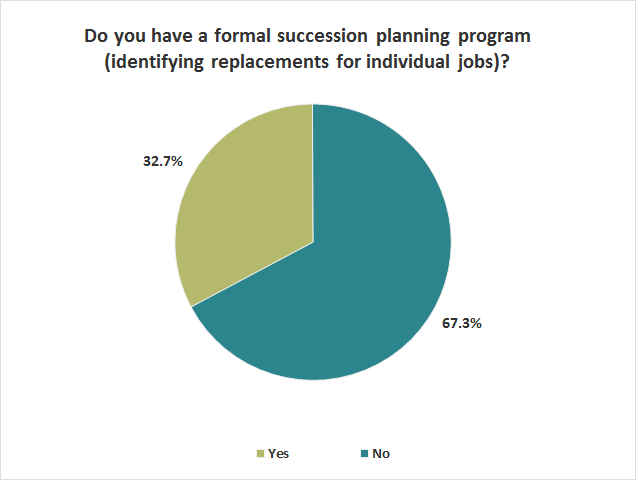
- The majority of participants were asked if they have a formal succession planning program in place. The majority (67.3%) indicated that they did not.
- Executive jobs were the least likely to be filled internally, with 46.9% of respondents saying that only 0%–10% of executive job openings were filled internally.
- The overwhelming majority of respondents (90.2%) said that they offered their high-potential employees “new responsibilities or challenges.”
- Participants were asked what they thought about performance evaluations. The number one response was, “they accomplish the intended goal most of the time” (46.9%).
- When asked about whether their supervisors are disciplined for poorly conducting performance evaluations, respondents were most likely to say “rarely” (35.8%) and “never” (35.1%).
Predicting Staffing and Talent Requirements
When asked if they maintain a system for predicting staffing or talent requirements, most respondents (68.8%) answered “No.” Only 31.2% said “Yes.”

Prediction Timeline
Survey takers were asked over what period of time they maintain a system for predicting staffing and talent requirements. The two most common answers were “annually” (38.5%) and “quarterly” (28.2%). The third most common answer was “monthly” (19.7%). Only 7.7% of respondents answered “More than 1 year.”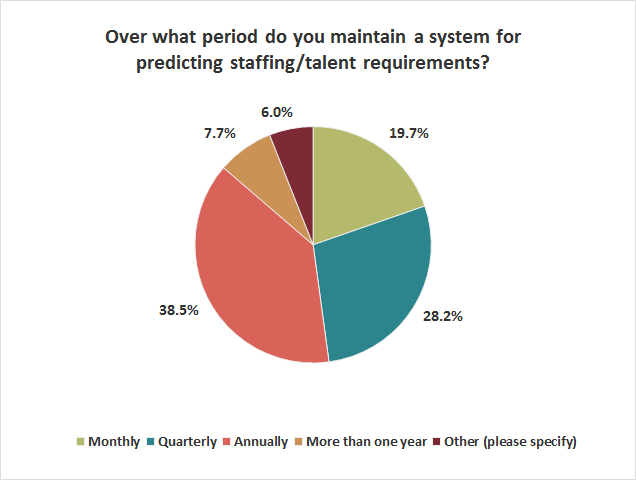
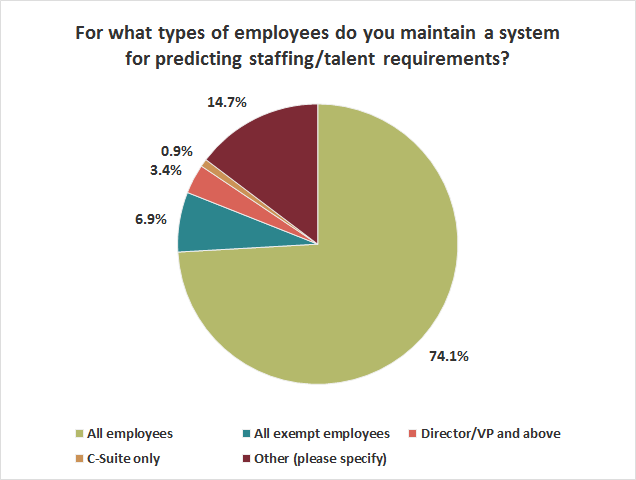
Prediction by Employee Type
The majority of respondents (74.1%) answered that they maintained a system for predicting staffing and talent requirements for all of their employees. Only a fraction of respondents (6.9%) indicated “all exempt employees” and a smaller group (3.4%) indicated “director/VP and above.” Less than 1% answered “C-suite only.” Among those polled, 14.7% answered “other.” Here are some of the most common “other” responses:
- Hourly employees
- Seasonal employees
- All nonexempt employees
Maintaining Prediction System
Over one-half (54.8%) of respondents indicated that they maintain their system for predicting staffing and talent requirements manually. Just above one-quarter (27.0%) answered that they maintain that system as “part of the human resources information system.” Only 12.2% indicated that theirs was a “stand-alone system.”

Predicting Talent Shortages
When survey takers were asked if they expect to face shortages of talent in areas that will impact their productivity or success, the majority (71.4%) answered “Yes.” Only 28.6% of respondents indicated “No.”

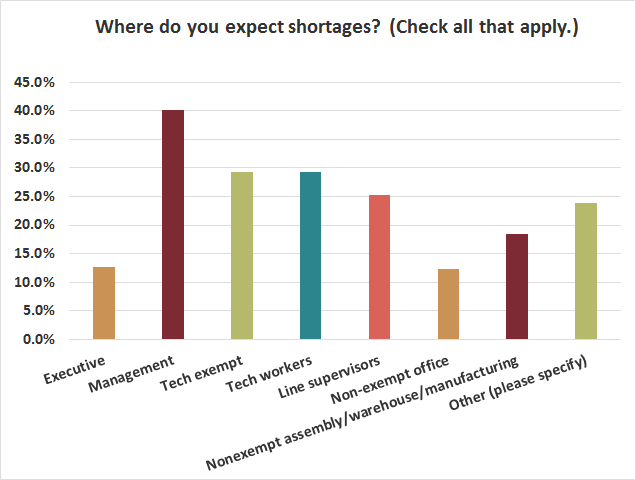
Shortages by Employee Group
Participants were asked where they expected to see talent shortages. The most common response (40.1%) was “management.” The next most common responses (29.2%) were tied between “tech-exempt” and “tech workers.” “executive” (12.6%) and “Nonexempt office” (12.3%) were nearly tied for the least common response. Just under one-quarter of the participants (23.8%) answered “other.” Here are some of the more common “other” responses:
- Nursing and healthcare
- Restaurant staff
- Direct caregivers
- Educational staff
- Consultants
Managing Shortages
The majority of participants (60.6%) indicated that they would deal with talent shortages with “training programs for current employees.” Furthermore, “high school/college relations programs” constituted the second most common answer (44.6%). Other answers included, “training programs for new employees” (39.0%), “engaging agency/search firms” (37.5%), and “hiring recruiting specialists” (29.7%). The least common answer was “other.” Here are some of those “other” responses:
- Job fairs
- Job boards
- Internal recruiting
- Advertising
- Pipelining candidates

Formal Succession Planning Program
Survey takers were asked if they have a formal succession planning program in place. The majority (67.3%) indicated that they did not. Approximately one-third (32.7%) of respondents answered “No.”
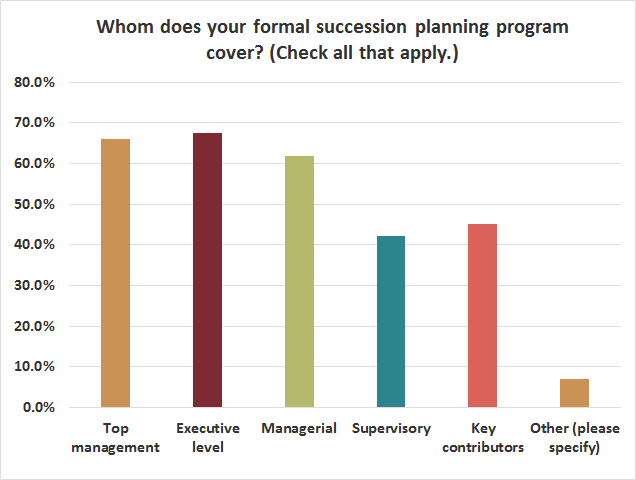
Succession Planning Coverage
When asked whom their formal succession planning program covers, the majority of respondents (67.5%) answered “executive level.” Almost as many participants (65.9%) answered “top management.” The answer “managerial” was the third most common response (61.9%), and “key contributors” was the fourth most common response (45.2%). The least common response was “supervisory” at 42.1%.
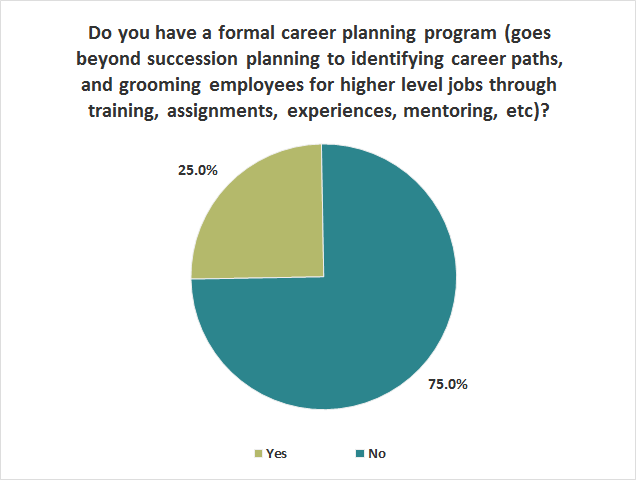
Formal Career Planning Program
Exactly three-quarters of respondents said they do not have a formal career program. One-quarter of respondents indicated that they do.
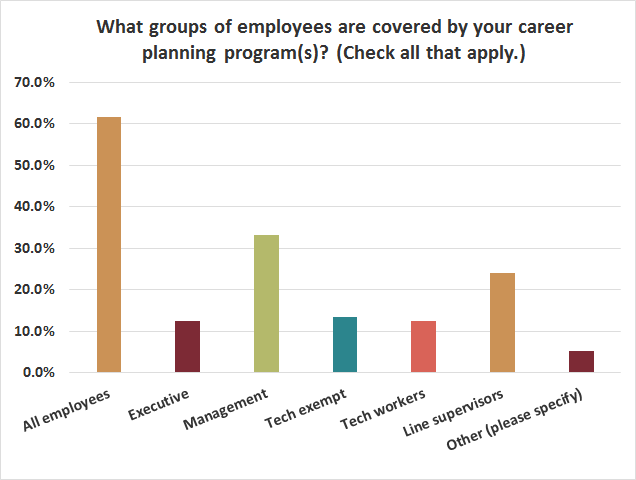
Career Planning by Career Group
The majority of respondents (61.5%) indicated that all of their employees are covered by their career planning programs. One-third of respondents (33.3%) indicated “management.” Around one-quarter of respondents (24.0%) answered “line supervisors.” Other groups, like tech workers, tech-exempt workers, and executives all hovered just above 12%.
Career Planning Meetings
When asked how often their career planning meetings are held, survey takers were most likely to respond “as needed” (46.9%). One-quarter of respondents answered “annually.” Only 21.9% of respondents indicated “quarterly.”

Filling Job Openings Internally
Executive jobs were the least likely to be filled internally, with 46.9% of respondents saying that only 0%–10% of executive job openings were filled internally. Nearly one-third (32.5%) of respondents answered that 50% or more of supervisory job openings were filled internally.

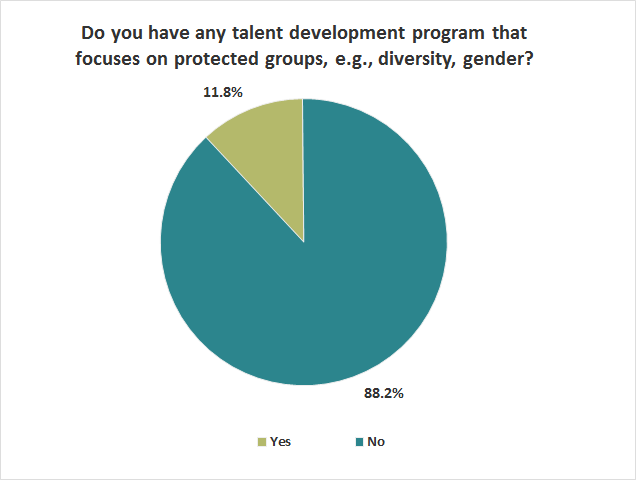
Talent Development Program
The majority of respondents (88.2%) indicated that they have no development program that focuses on protected groups. Only 11.8% said that they do.
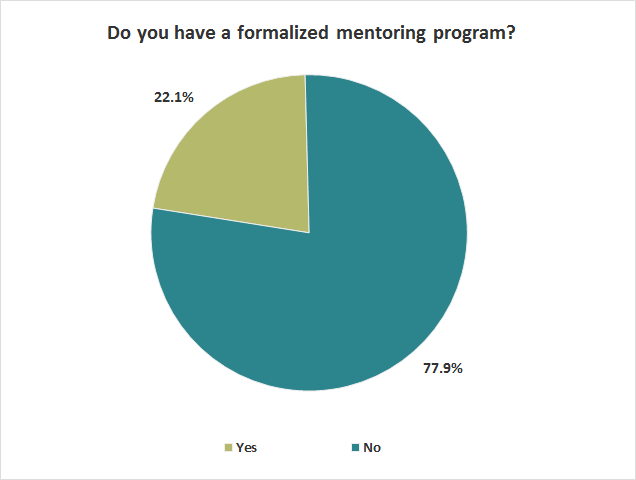
Formal Mentoring Program
Most participants (77.9%) answered that they do not have a formalized mentoring program. Only 22.1% of respondents answered that they do.
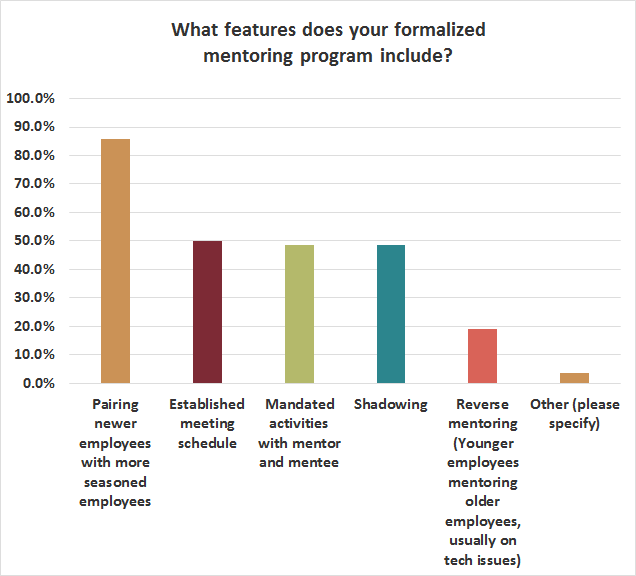
Mentoring Program Coverage
Of those participants that said they do have a formalized mentoring program, the majority (85.9%) said the program includes “pairing newer employees with more seasoned employees.” There was a similar three-way divide among the answers “established meeting schedule” (50.0%), “mandated activities with mentor and mentee” (48.7%), and “shadowing” (48.7%). The least common response was “reverse mentoring,” where younger employees mentor older employees, usually on tech issues.
Identifying (High Potential Employees) HiPos
When asked if they have a system for identifying high-potential employees (HiPos), the majority of respondents (63.6%) said “No.” A little over one-third of respondents (36.4%) said that they do.

HiPo Identification Methods
Respondents who answered “Yes” to the previous question were asked what system they had for identifying HiPos. The majority of respondents (63.2%) answered, “managers keep an eye out for HiPos.” Over one-half (54.9%) of respondents indicated “It’s built into our normal performance management system.” The third most common response (45.9%) was “an informal process involving either discussion or managerial input.” Dedicated software and paper solutions scored the lowest, with 7.5% and 9.0% respectively.

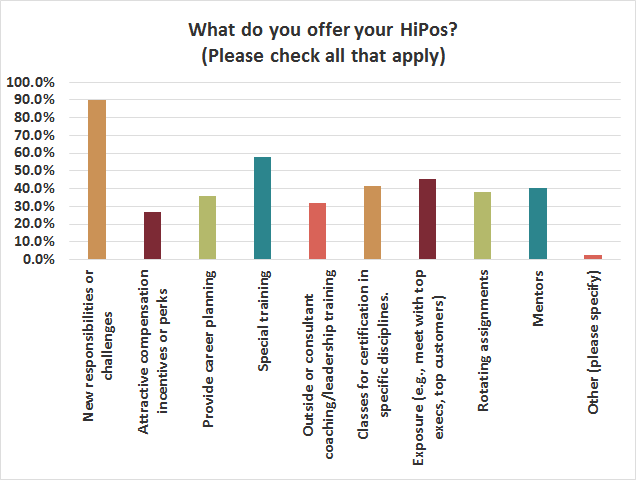
Managing HiPos
The overwhelming majority of respondents (90.2%) said that they offered their HiPos “new responsibilities or challenges.” The second most common answer given by respondents (57.6%) was “special training.” The least common response given by participants (26.5%) was “attractive compensation incentives or perks.”
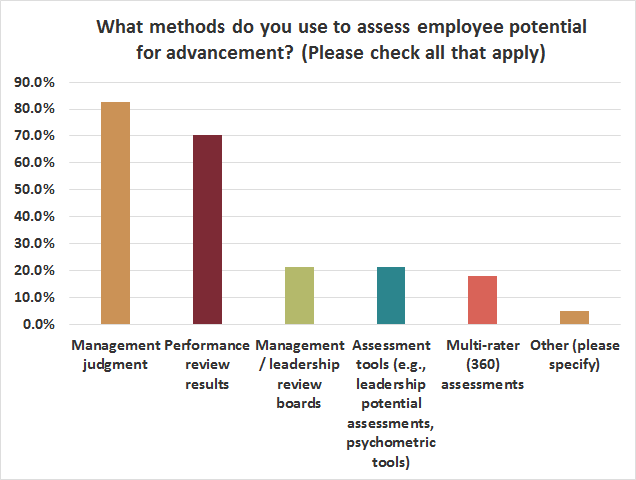
Employee Potential and Advancement
Survey takers were asked what methods they use to assess employee potential for advancement. Two responses towered over the others. The first, selected by 82.7% of the respondents was “management judgement.” The second, selected by 70.2% of the respondents was “performance review results.” The other three choices all scored just above or just under 20%. Only 5.0% of respondents answered “other.” Here are some of these “other” responses:
- Employee interest
- Job interviews
- Attitude and willingness to do the extra tasks
- Client feedback
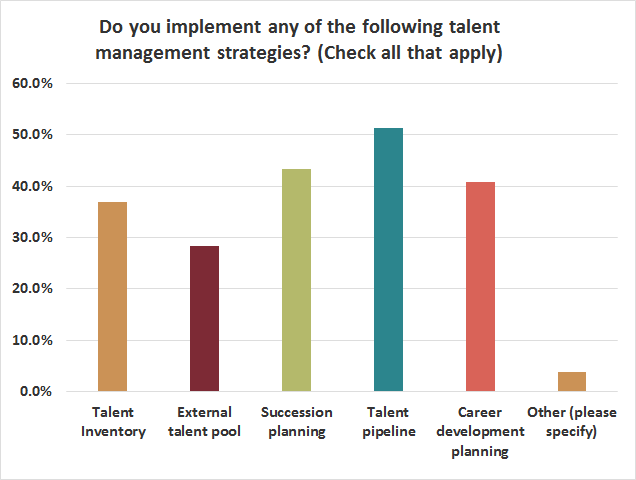
Implementing Talent Management Strategies
The majority of respondents (51.3%) answered that they implement a “talent pipeline” as their management strategy. “Succession planning” was indicated by 43.4% of respondents, and “career development planning” was indicated by 40.8% of respondents. Only 3.8% of respondents answered “other.” Here are some of those “other” responses:
- Random appointments by cronyism
- Tuition reimbursement
- Roll the dice
Leadership Training
Nearly three-quarters of participants (73.7%) answered that they train potential leaders in “leadership/management.” “Communication” was indicated by 61.2% of participants, and “company mission and values” by 57.6% of participants. Among the least common responses were “negotiation” (15.8%) and “union relations” (10.2%). Only 5.6% of respondents answered “other.” Here are some of those “other” responses:
- Diversity and conflict resolution
- Delegating tasks
- Financial and business metrics
- Technical knowhow
| In which areas do you train potential leaders? (Please check all that apply.) | |
| Answer Options | Response Percent |
| Leadership/management | 73.7% |
| Communication | 61.2% |
| Company mission and values | 57.6% |
| Team building | 53.0% |
| Dealing/coping with problem employees | 50.7% |
| Compliance | 49.7% |
| Ethics/integrity | 48.0% |
| Time management | 38.5% |
| Presentation skills | 33.6% |
| Negotiation | 15.8% |
| Union relations | 10.2% |
| Other (please specify) | 5.6% |
Talent Management Challenges
When asked what challenges they encounter when trying to offer talent management programs, the majority of respondents (63.1%) answered “limited budget.” The second most common answer was “not enough time for training,” at 58.0%. Other common responses were “lack of measurements/metrics for training” (36.6%), “scheduling training” (34.8%), and “lack of management support” (32.4%). Less than 5% of respondents answered “other.” The number one “other” response involved not having enough staff.
| What challenges (if any) do you encounter in trying to offer talent management programs? (Check all that apply.) | |
| Answer Options | Response Percent |
| Limited budget | 63.1% |
| Not enough time for training | 58.0% |
| Lack of measurements/metrics for training | 36.6% |
| Scheduling training | 34.8% |
| Lack of management support | 32.4% |
| Logistics, multiple locations | 26.4% |
| No training staff | 26.4% |
| Inadequate training materials | 21.6% |
| Lack of employee interest | 19.5% |
| Ineffective training | 14.4% |
| Language barriers | 9.6% |
| Other (please specify) | 4.2% |
Recommended Resources
When asked to recommend various resources, the majority of respondents (63.4%) answered “Society for Human Resource Management (SHRM).” Other common responses included “HR.BLR.com®” (46.7%), “Business and Legal Resources (BLR)” (37.9%), and “Human Resources Certification Institute (HRCI)” (35.9%). Only 7.8% of respondents answered “other.” Here are some of the most common “other” responses:
- In-house
- Industry seminars
- Colleges
| Based on your experience with the following resources, please check those you would recommend. (Check all that apply.) | |
| Answer Options | Response Percent |
| Society for Human Resource Management (SHRM) | 63.4% |
| HR.BLR.com | 46.7% |
| Business and Legal Resources (BLR) | 37.9% |
| Human Resources Certification Institute (HRCI) | 35.9% |
| HR.com | 35.6% |
| American Management Association (AMA) | 33.3% |
| U.S. Department of Labor | 31.7% |
| American Society for Training and Development (ASTD) | 26.5% |
| Occupational Safety and Health Administration (OSHA) | 24.8% |
| State Department of Labor | 24.8% |
| Equal Employment Opportunity Commission (EEOC) | 23.5% |
| World at Work | 21.9% |
| HRHero.com | 19.6% |
| HRLaws.com | 17.3% |
| J.J. Keller | 15.7% |
| Bloomberg/BNA | 12.1% |
| Lorman Education Services | 7.5% |
| Thompson Publishing | 7.2% |
| TrainingToday.com | 7.2% |
| HRLearningCenter.com | 6.9% |
| HRTrainingCenter.com | 6.9% |
| Business 21 Publishing | 6.2% |
| United States Citizenship and Immigration Services (USCIS) | 5.9% |
| Other (please specify) | 7.8% |
Programs and Suggestions
Participants were asked if they have any other programs or suggestions relating to talent management to share with fellow HR professionals. Here are some of the many responses we received:
- “Aspire Leadership Training.”
- “Local universities community programs.”
- “Three-year rotational assignments for campus recruits, international service assignments, and 6 Sigma training for mid-level and senior leaders.”
- “We tap a lot of the local colleges and universities.”
- “Lots of ‘how-to’ and ‘screw the broad picture’ theory. Most education is worthless because it doesn’t have how to do it, just broad goals and no way to actually accomplish tasks.”
- “Malcom Baldrige criteria for performance excellence. Identify key processes and cross-train on those processes within the organization.”
- “Various EAP Program Offerings.”
- “Expert Panel of HR Professionals Program.”
- “Harvard Management Mentor.”
- “Mindful Management from WLB Consulting.”
- “LeadershipIQ—Mark Murphy’s book Hiring for Attitude.”
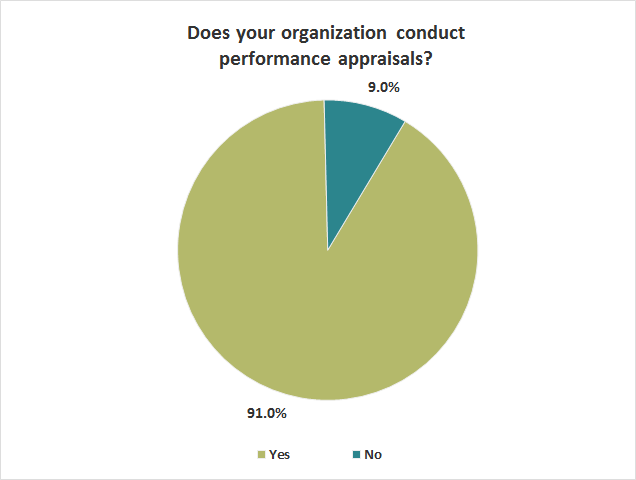
Performance Appraisals
The overwhelming majority of survey takers (91.0%) said their organization conducts performance appraisals. Only 9.0% of respondents said their organization does not.
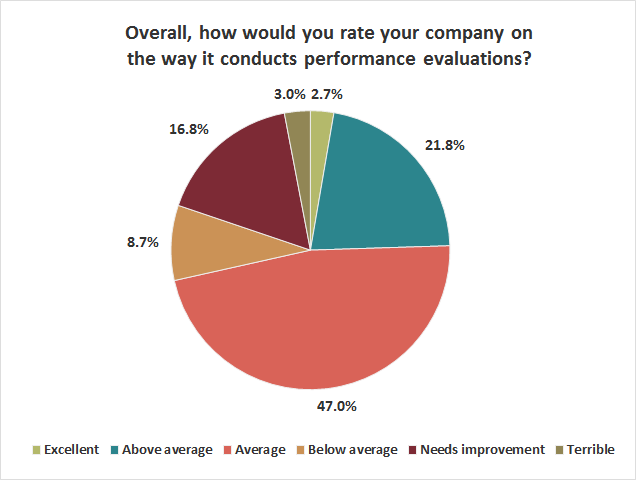
Rating Performance Evaluations
The leading response (47.0%) for participants asked about how they would rate their company’s performance evaluation system was “average.” Only 2.7% of respondents indicated “excellent.” Just over one-fifth of respondents (21.8%) answered “above average.” The total percentage of respondents answering “below average,” “needs improvement,” or “terrible” is 28.5%.
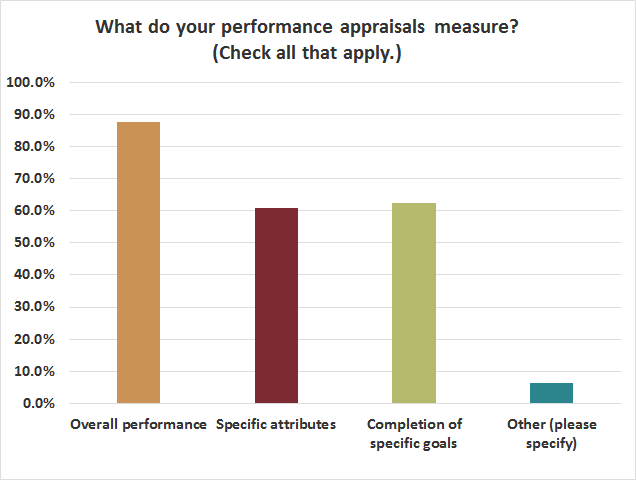
Performance Appraisal Coverage
Most of the respondents (87.5%) answered that their performance appraisals measure “overall performance.” About the same number of respondents answered “specific attributes” (60.8%) and “completion of specific goals” (62.5%). Just over 6% of participants answered “other.” Here are some of those “other” responses:
- Developmental needs, possibility for promotion
- Workforce competencies
- Teamwork
- Achievement of the company’s core values
- “BS.”
Appraising Nonexempt Employees
The majority of respondents (88.2%) answered that their appraisal process for nonexempt employees included “quality of work.” Other common responses include “attitude/cooperation” (78.5%), “dependability/reliability” (69.9%), and “communication skills” (68.9%). Of those who answered, 8.0% indicated “other.” Here are some of those “other” responses:
- Teamwork
- Job knowledge and technical abilities
- Specific job functions, diversity, and inclusion
- Our company values
| Which of the following are included in your appraisal process for nonexempt employees? (Check all that apply.) | |
| Answer Options | Response Percent |
| Quality of work | 88.2% |
| Attitude/cooperation | 78.5% |
| Dependability/reliability | 69.9% |
| Communication skills | 68.9% |
| Attendance/punctuality | 67.5% |
| Customer service (internal and/or external) | 66.1% |
| Quantity of work | 59.5% |
| Interpersonal relationships | 57.1% |
| Compliance/adherence to policy | 55.7% |
| Initiative | 51.9% |
| Safety | 41.9% |
| Flexibility | 39.8% |
| Resourcefulness | 31.1% |
| Creativity | 26.6% |
| Other (please specify) | 8.0% |
Appraising Exempt Employees
The majority of respondents (80.2%) said that their appraisal process for exempt employees included “communication skills.” Other common responses include “achievement of preset goals” (74.2%), “job knowledge” (72.1%), and “decision making” (68.9%). Just over 6% of participants answered “other.” Here are some of those “other” responses:
- Strategic thinking, fosters change, team effectiveness, builds buy-in
- Results
- Top 5 goals
- Teamwork and flexibility
| Which of the following are included in your appraisal process for exempt employees? (Check all that apply.) | |
| Answer Options | Response Percent |
| Communication skills | 80.2% |
| Achievement of preset goals | 74.2% |
| Job knowledge | 72.1% |
| Decision making | 68.9% |
| Leadership | 65.4% |
| Problem solving | 63.3% |
| Attitude/cooperation | 62.9% |
| Customer service (internal and/or external) | 60.4% |
| Dependability/reliability | 54.8% |
| Judgment | 54.4% |
| Compliance/adherence to policy | 50.9% |
| Initiative | 50.9% |
| Business relationships | 49.8% |
| Technical knowledge | 48.4% |
| Adaptability | 46.3% |
| Productivity | 45.9% |
| Staff development | 45.9% |
| Planning | 44.9% |
| Attendance/punctuality | 37.8% |
| Creativity | 37.1% |
| Financial management | 36.7% |
| Organizing ability | 35.3% |
| Staff utilization | 22.6% |
| Other (please specify) | 6.4% |
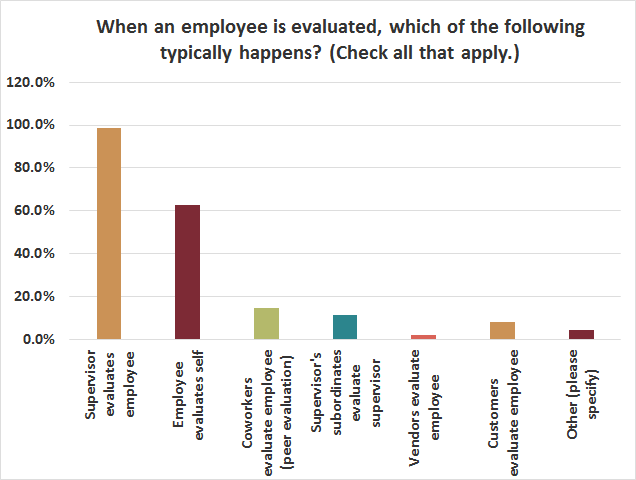
Performance Evaluation Methods
Participants were asked how their employee evaluations are conducted. The vast majority of respondents (98.6%) answered “supervisor evaluates employee.” The only other answer that received significant responses was “employee evaluates self” (62.9%). The remaining possible answers rated much lower. Only 4.5% of respondents answered “other.” Here are some of those “other” responses:
- CEO meets with employee and supervisor to review evaluation.
- Upper management approves supervisor’s evaluation.
- HR signs off on all evaluations and sits in on all meetings.
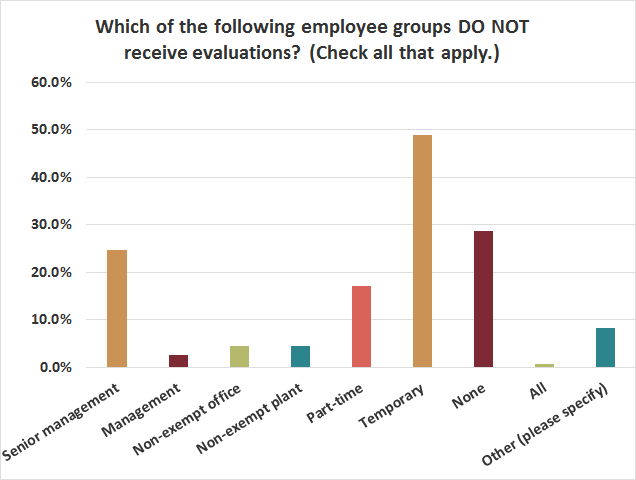
Who Is Not Evaluated?
When participants were asked which employee groups do not receive evaluations, 48.9% answered “temporary.” The next most common responses were “none” (28.7%) and “senior management” (24.6%). Of those polled, 8.2% answered “other.” Here are some of those “other” responses:
- Union employees.
- “Two of our four owners.”
- Only the President does not receive a formalized evaluation.
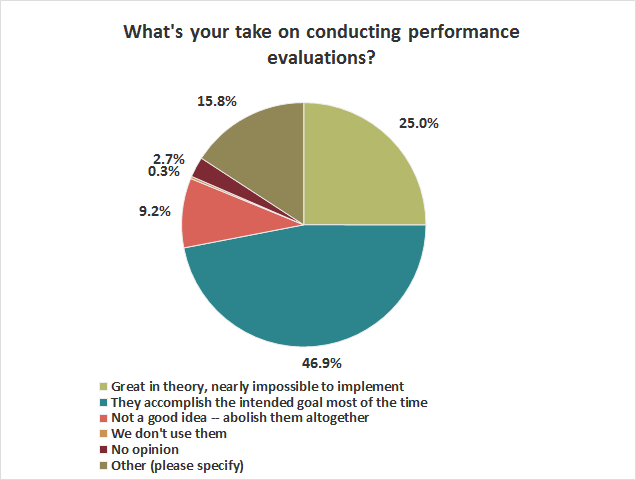
The Value of Performance Evaluations
Participants were asked what they thought about performance evaluations. The number one response was, “They accomplish the intended goal most of the time” (46.9%). One-quarter of survey takers answered, “Great in theory, nearly impossible to implement.” Only 9.2% of participants indicated “Not a good idea—abolish them altogether.” The smallest portion of respondents (2.7%) had no opinion at all, and 15.8% answered “other.” Here are some of those “other” responses:
- “Good, but we need to update our process.”
- “Poorly designed at my organization, and poorly implemented.”
- “Great, if people are properly trained and the format used is geared appropriately toward the organization’s culture/mission and toward the group receiving it (managers vs. nonexempt staff, etc.).”
- “A poor way to increase employee-supervisor communication.”
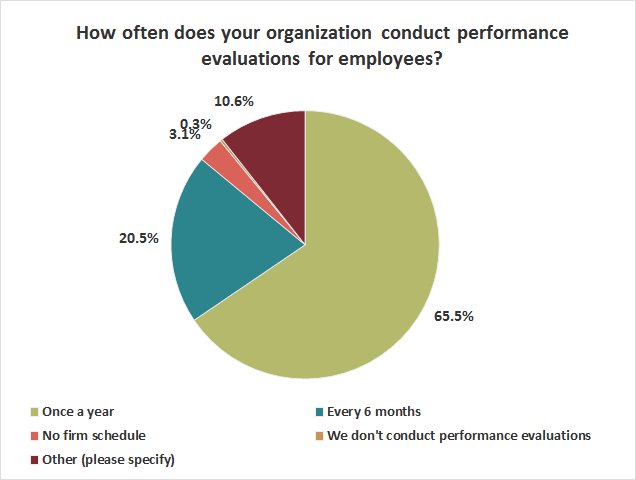
Performance Evaluation Timeline
The majority of respondents (65.5%) answered “once a year” when asked how often their organization conducts performance evaluations. Significantly fewer (20.5%) indicated “every 6 months.” Only one respondent answered “We don’t conduct performance evaluations,” and just a handful (3.1%) answered “no firm schedule.” Just over 10% of survey takers answered “other.” The most common “other” answers were “quarterly” and “90 days after hiring.” Here are some more of the “other” answers:
- “Annually, with a midyear review.”
- “We have gotten away from them—been in survival mode. Plan to re-implement.”
- “Employee handbook indicates annual—just not followed.”
- “Managers get reviewed yearly, some lower staff should be every 6 months—but it’s not often done.”
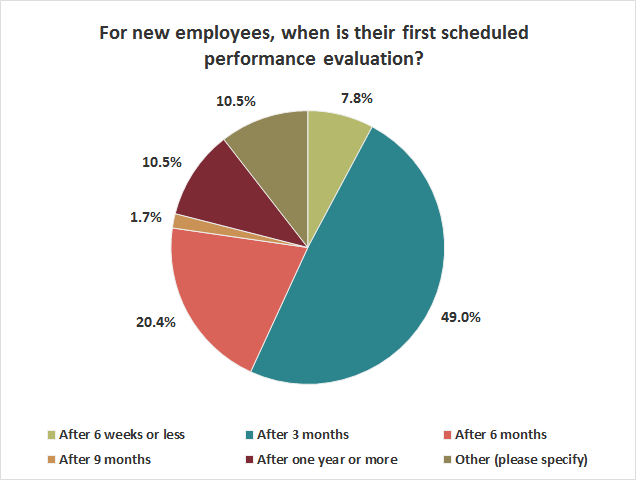
The First Performance Evaluation
Just under one-half of those polled (49.0%) answered that their new employees receive their first performance evaluation “after 3 months.” Just over 20% indicated “after 6 months.” The least common response was “after 9 months” (1.7%). The same number of respondents answered “after 1 year or more” as answered “other” (10.5%). Here are some of those “other” responses:
- “During the next review cycle.”
- “Conversation within a month.”
- “No formal evaluation.”
- “We consistently meet with new hires to train, coach, and give feedback to ensure success.”
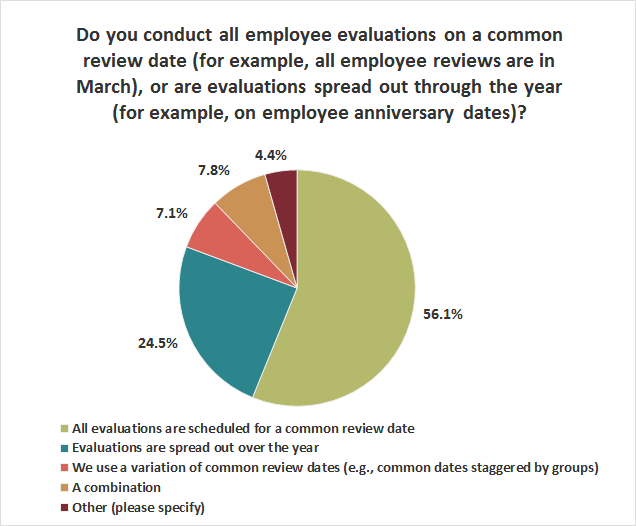
Evaluation Review Date
The majority of survey takers (56.1%) indicated that their employee evaluations all occur at the same time. Just under one-quarter (24.5%) of survey takers answered, “evaluations are spread over the year.” The answers “a variation of common review dates” and “a combination” received a similar response number—7.1% and 7.8%, respectively.
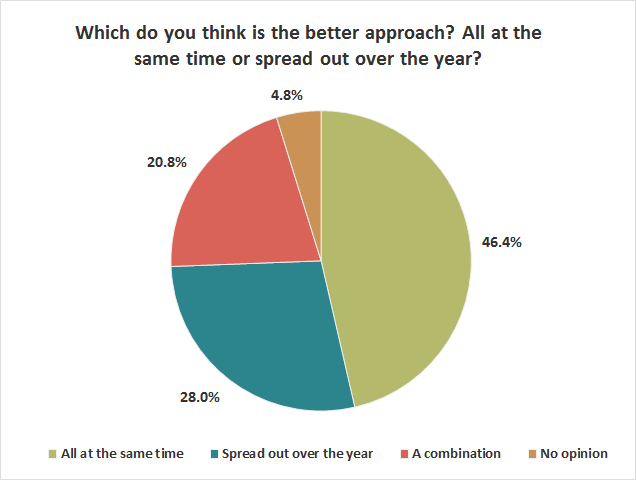
Concurrent vs. Sporadic Evaluations
When respondents were asked if they thought that all reviews at the same time was better or worse than reviews spread out over the year, 46.4% answered, “all at the same time.” Fewer (28.0%) respondents answered “spread out over the year,” and approximately one-fifth of respondents (20.8%) answered “a combination.” Only 4.8% of respondents indicated that they had no opinion.
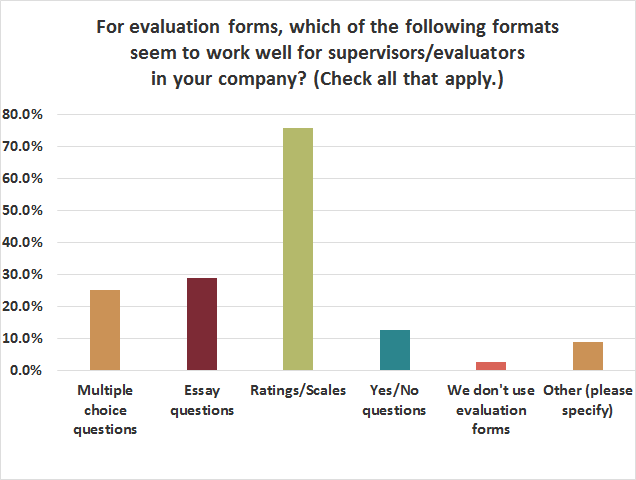
Evaluation Forms
Participants were asked what kinds of evaluation forms were best for supervisors. The majority (75.8%) said “ratings/scales.” Many fewer respondents answered “essay questions” (28.7%) and “multiple-choice questions” (24.9%). A scant 2.7% answered “We don’t use evaluation forms.” Just under 9% of respondents indicated “other.” Here are some of those “other” responses:
- “Nothing works well, currently.”
- “We use an essay format—not sure if that’s the best.”
- “Combination of checklist and short essay.”
- “Ratings supported by qualitative summary of performance and behaviors.”
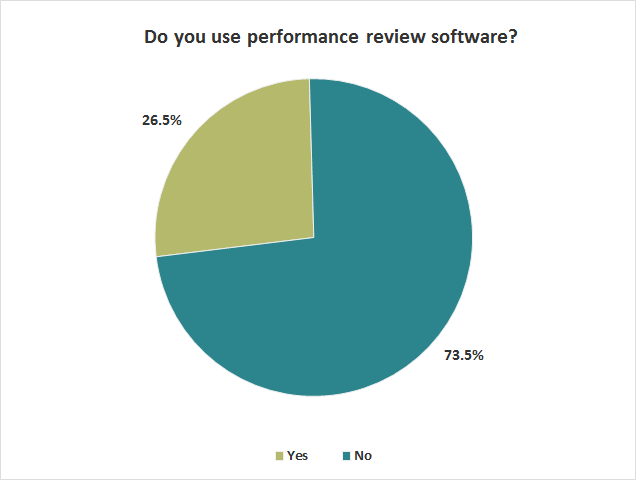
Performance Review Software
Just under three-quarters of survey takers (73.5%) answered that they do not use performance review software. That leaves 26.5% that answered that they do.
What Software Do You Use?
Types of software are so varied that the number one answer for the question, “If you use performance management software, what kind do you use?” was “other.” The next highest response (13.3%) was “SuccessFactors.” Here are the most common “other” responses:
- In-house
- ADP
- None
| If you use performance management software, what kind do you use? (Check all that apply.) | |
| Answer Options | Response Percent |
| Other (please specify) | 57.1% |
| SAP SuccessFactors | 13.3% |
| Halogen eAppraisal | 9.2% |
| Workday Performance Management | 7.1% |
| Appraisal Smart | 3.1% |
| Kenexa | 3.1% |
| TalentQuest | 3.1% |
| Taleo Perform | 3.1% |
| Cornerstone OnDemand | 2.0% |
| My Talent Link | 2.0% |
| PeopleStreme | 2.0% |
| Review Snap | 2.0% |
| Saba Performance Suite | 2.0% |
| SAS Talent Scorecard | 2.0% |
| SilkRoad Wingspan | 2.0% |
| Bullseye Evaluation | 1.0% |
| Cognito HRM | 1.0% |
| Kapta | 1.0% |
| LearnShare | 1.0% |
| Perfode Appraiser | 1.0% |
| Talentevo | 1.0% |
| TalentGuard | 1.0% |
| Cezanne Performance | 0.0% |
| Promantek TrakStar | 0.0% |
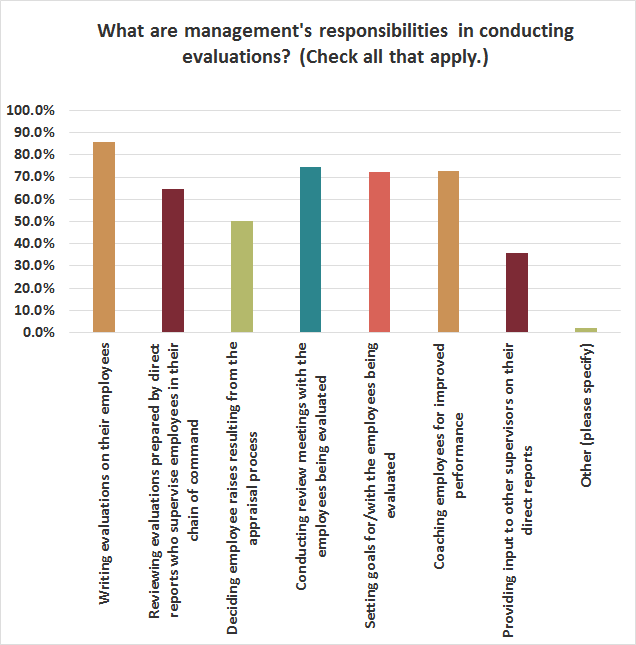
Management’s Evaluation Responsibilities
When asked what the role of managers was when it came to conducting evaluations, the majority (85.9%) of respondents indicated, “Writing evaluations on their employees.” Some of the other most common responses were “conducting review meetings with the employees” (74.5%), “coaching employees for improved performance” (72.8%), and “setting goals for/with the employees being evaluated” (72.4%). The least common response (35.9%), besides “other,” was “providing input to other supervisors on their direct reports.”
3 Worst Unintentional Supervisor Errors
Participants were asked to select the three worst unintentional supervisor errors. The three top errors were:
- “Recency effect (Rater focuses on most recent performance rather than entire review period.)” (63.8%)
- “Central tendency (Rater doesn’t want to hurt feelings or overrate so places all employees in the middle of the scale.)” (54.3%)
- “Leniency effect (Rater overrates to avoid making enemies.)” (47.5%)
| What are the three worst unintentional errors that supervisors (or other evaluators) make when it comes to evaluations? Please select only 3. | |
| Answer Options | Response Percent |
| “Recency” effect (Rater focuses on most recent performance rather than entire review period.) | 63.8% |
| Central tendency (Rater doesn’t want to hurt feelings or overrate, so places all employees in the middle of the scale.) | 54.3% |
| Leniency effect (Rater overrates to avoid making enemies.) | 47.5% |
| Perceptual bias (Raters base rating on their own perception of what is right, wrong, or acceptable.) | 34.0% |
| “Just like me” tendency (Overrates employees who share his/her own interests/beliefs.) | 31.2% |
| Halo effect (Rater evaluates overall performance based on a single area in which the employee excels.) | 28.0% |
| Primacy effect (Rater focuses on a good or bad incident from when the employee first came under his/her supervision.) | 19.9% |
| Horn effect (Rater underrates overall performance based on a single negative impression of the employee.) | 17.0% |
| Other (please specify) | 1.4% |
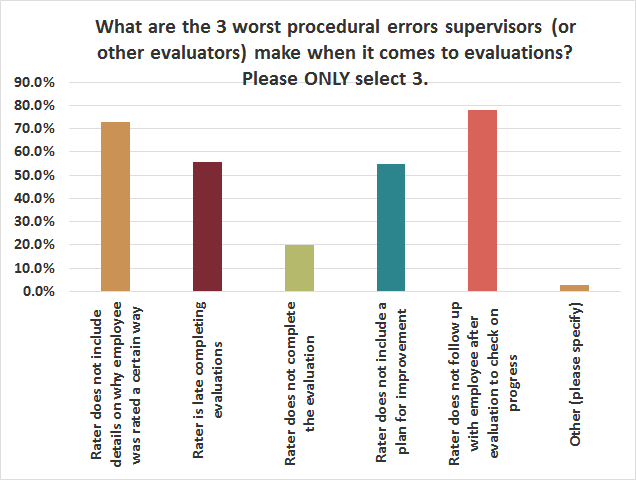
3 Worst Procedural Supervisor Errors
Participants were asked to select the three worst procedural supervisor errors. The top three errors were:
- “Rater does not follow up with employee after evaluation to check on progress” (78.1%).
- “Rater does not include details on why employee was rated a certain way” (72.8%).
- “Rater is late completing evaluations” (55.8%).
Disciplining Supervisors
When asked about whether their supervisors are disciplined for poorly conducting performance evaluations, respondents were most likely to say “rarely” (35.8%) and “never” (35.1%). Only 10.2% answered, “Yes, usually,” and 15.8% answered “sometimes.” Only 3.2% of respondents answered “other.” Here are some of those “other” responses:
- “They are not allowed to deliver poor evaluations.”
- “It depends on who they report to, some do and some don’t.”
- “Unknown.”

Performance Evaluation Training
Approximately the same percentage of respondents answered that their organizations conduct training for performance evaluators “annually” (26.0%), “never” (25.3%), and “only for new supervisors/managers” (23.9%). Only 10.2% of respondents answered “more often than once a year.” A small few (4.9%) answered “every other year.” Just under 10% of respondents answered “other.” Here are some of those “other” responses:
- Rarely
- Once in a while
- As needed
- “We are working to eliminate performance reviews, so we meet regularly to begin this transition.”

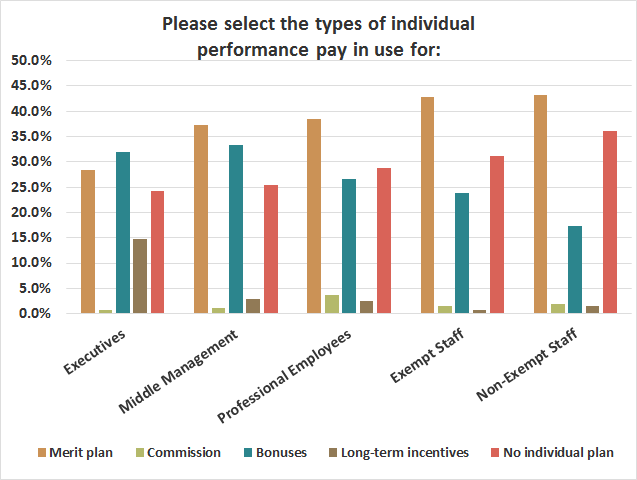
Performance Pay by Career Group
Respondents indicated that as you move down the food chain, the following things happen when it comes to individual performance pay:
- Merit plans become more common.
- There is a greater chance that there is no plan.
- Bonuses become less common.
- Long-term incentives become virtually nonexistent.
Performance Appraisal Alternatives
At the conclusion of the survey, participants were asked to write what they do if they don’t conduct standard performance appraisals. Here are some of the most interesting responses:
“Catalytic coaching.”
“Randomly increase salary.”
“Judgement appraisal.”
“Use your own arbitrary preferences.”
“Provide consistent role expectations, and provide consistent feedback in line with these—no static formality.”
“We OVER-communicate! We reward constantly. We demand high levels of trust and respect throughout the organization.”
“It’s a review, not an appraisal. It is not mandatory.”
“On job evaluation with the quality of work performed.”
“Management opinion.”
“Informal feedback”
“Informal review by supervisors.”
“President decides.”
“Consider performance statistics and customer evaluations.”
“We will be using anecdotal records consistently updated to do quarterly ‘reviews.’”
“Bonus based upon CEO’s discretion.”
“360[-degree] feedback surveys and customer surveys are what we use for annual performance reviews.”
“We do currently conduct, but are looking to moving to a ‘forward-looking’ process, and addressing poor performance immediately with performance improvement plans. Also addressing desired behaviors in an immediate fashion with noncash rewards and recognition (to reinforce).”
“We are in the planning stages to implement reviews. Currently, raises are given to all employees at the same percentage.”
“For hourly employees, there are standard minimum wage pay increases unrelated to performance.”
“Ongoing feedback.”
“Not a thing.”
“Leave it to the union stewards for nonexempt.”
“Conduct appraisals according to the whim of the appraising manager.”
Who Responded?
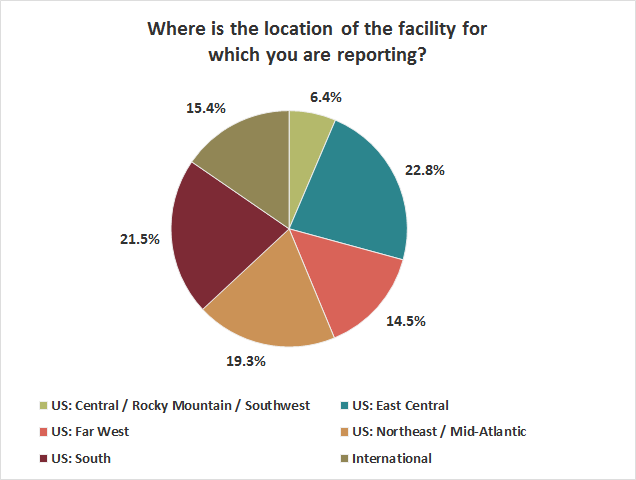
A total of 441 participants responded to the 2016 Talent and Performance Management Survey, representing a diverse array of industries, business types, organizational sizes, and locations. Respondents hailed from all across the United States and also from around the world. Most of the respondents (22.8%) hail from the U.S. East Central region, with nearly as many (21.5%) hailing from the U.S. South. Just under one-fifth (19.3%) of respondents hail from the U.S. Northeast/Mid-Atlantic. The International community (15.4%) and the U.S. Far West (14.5%) are almost equally represented. The smallest pool of respondents (6.4%) are from the U.S. Central/Rocky Mountain/Southwest region.
Most of the respondents (55.4%) answered that they were from the “privately owned” sector. Significantly fewer (14.6%) indicated they were from the “Not-for-profit” sector. The third most common sector indicated (9.9%) was the “public corporation.” Only 5.1% of respondents work in the government sector; all other sectors were negligibly represented.
| Please select the category that best describes your business type: | |
| Answer Options | Response Percent |
| Privately owned | 55.4% |
| Not-for-profit | 14.6% |
| Public corporation | 9.9% |
| City, parish, county, state, or federal government | 5.1% |
| Employee- or member-owned | 3.2% |
| Other (please specify) | 3.2% |
| Quasi-government | 2.9% |
| Cooperative | 1.6% |
| Public school or college/university | 1.6% |
| Private school or college/university | 1.3% |
| Native/tribal organization | 1.0% |
| Native/tribal corporation | 0.3% |
Respondents identified themselves as being employed in 21 different industry categories as follows:
| Please select the industry category that best describes the nature of your business. (All organizations should fit into one of the categories listed below. If in doubt about where your company fits in this list, check the sector list here.) | |
| Answer Options | Response Percent |
| Manufacturing | 20.5% |
| Other (please specify) | 13.6% |
| Health care and social assistance | 13.2% |
| Professional, scientific, or technical services | 7.6% |
| Finance and insurance | 6.3% |
| Transportation and warehousing | 6.0% |
| Educational services | 4.4% |
| Other services (except public administration) | 3.5% |
| Public administration | 3.5% |
| Retail trade | 3.5% |
| Construction | 2.8% |
| Utilities | 2.5% |
| Accommodation or food services | 2.2% |
| Information (media, data, telecommunication) | 2.2% |
| Real estate and rental and leasing | 1.9% |
| Wholesale trade | 1.9% |
| Arts, entertainment, and recreation | 1.6% |
| Administrative and support services | 0.9% |
| Management of companies and enterprises | 0.9% |
| Agriculture, forestry, fishing, and hunting | 0.3% |
| Mining, quarrying, and oil and gas extraction | 0.3% |
| Waste management/remediation services | 0.3% |
The number one most common job title (31.3%) was “HR manager” followed by “HR director” (24.1%). The next most common response (16.0%) was “other area with HR responsibility added.” The same percentage of respondents answered “HR generalist” and “HR VP or higher,” both at 8.8%. All other job titles were negligible.
| Job title or position | |
| Answer Options | Response Percent |
| HR manager | 31.3% |
| HR director | 24.1% |
| Other area with HR responsibilities added (please specify) | 16.0% |
| HR generalist | 8.8% |
| HR VP or higher | 8.8% |
| HR specialist | 4.9% |
| HR coordinator/assistant | 4.6% |
| Benefits manager | 0.7% |
| Benefits VP or higher | 0.7% |
| Benefits coordinator/assistant | 0.3% |
| Benefits director | 0.0% |