Project profitability analysis is crucial to the success of a project. AssessTEAM can get you and your project managers real-time visibility into the people and processes that lead to project profitability or losses.
Project profitability management is slowly being integrated into both external and internal projects. Knowing how your employees performed on a customer project is crucial but it is also important to evaluate how your HR executed an internal initiative.
We empower project managers to meet project objectives, deliver profitability and ensure client satisfaction by giving them real-time project profitability analysis at their fingertips.
AssessTEAM premium and enterprise tools include the ability to evaluate project performance on competencies with real-time comparison of project spend vs project revenue.
Setting up projects on AssessTEAM
The first step in starting to use project profitability analysis is to either add a new project one at a time or import your projects in bulk from systems like Basecamp, Wrike and 1200 other software linked via Zapier.
The project profile will include customer details, projected hours, budget, and project start date. Resources can be assigned to the project from within this project profile page. Project managers can be assigned who would then have full visibility of the project on the web and mobile app.
Budgets for time investment in hours, revenue estimates and fixed costs can be adjusted anytime by administrators or project managers.
Projects that are reoccurring in nature like monthly or yearly contracts can be configured to recur automatically at completion.
Tracking project time investment
Having set up your project profile, Premium and Enterprise plan users of AssessTEAM can start tracking project time investment. When a project team member logs in they can add their timesheets and view all projects assigned to them. Time can be added on a daily or monthly basis via the AssesTEAM web or mobile app. AssessTEAM will compare the projected hours with the actual hours to see if the project is healthy or at risk, numerous reports plot effort investment by people, by teams and by month on a graph for easy analysis.
Projects that are close to their budgeted hours show at risk on the project manager console, project managers also get a list of such at-risk projects on email.
Tracking project profitability
Employee time is collected from timesheets, multiplied with their hourly pay rate and compared to the project budget to compute real-time profitability
It’s important that the project budget must be on the project profile and hourly rate for all people involved in the project is defined, use our tools to convert monthly or yearly remunerations to hourly pay rate.
To include project overheads in your actual costs, (in addition to labor costs), you can add ‘fixed expenses’ to the project profile. Fixed expenses reoccur for reoccurring projects.
AssessTEAM will automatically calculate project profitability with the following formula.
Project budget + Change orders – Project spend (Employee timesheets x Hourly pay rate) – Fixed expenses = Project profit
Based on the expected profit margin defined on the project profile the project is then classified as meets targets or does not meet targets. Targets are profitability targets and time targets, a project can be at risk if either one of the targets fails to be met.
Reporting and Analysis
Having configured the systems correctly Premium and Enterprise users of AssessTEAM can use the reporting and analysis features to review project profitability. Enterprise Plan users can also view project profitability reports and detailed team profitability analysis.
Both premium and enterprise plan users can run reports on the time logged on timesheets and pull up data on time investment analysis per project, team or by an individual. The reports include 100+ graphs and charts with options to export the data out in CSV or PDF.
Effort investment by department
This pie chart shows a clean split up of effort investment by team in the entire organization. The information here comes from timesheets completed on the web and the app by all team members, the graphic pretty much shows you where is the largest amount of time investment happenning.
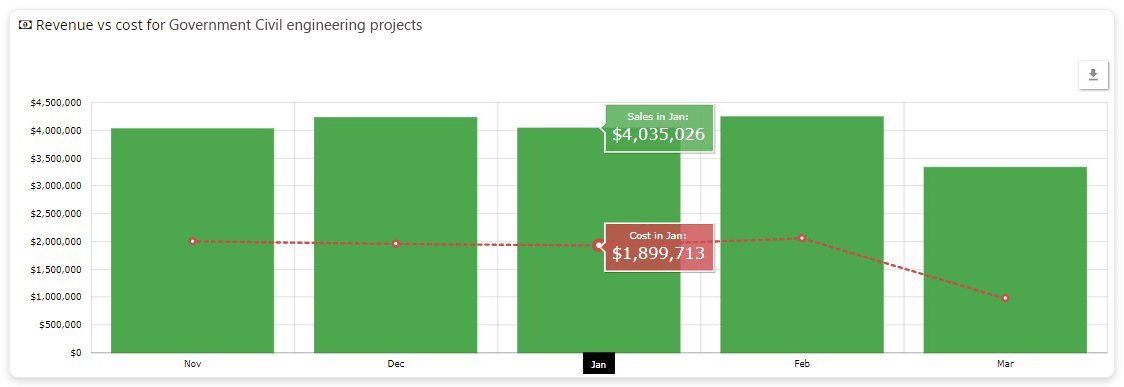
Project revenue vs project spend
This is one of the most important if not the most important report for any organization, the green bar shows the revenue vs the red line that shows expenses. This bar graph clearly shows what is your gross profit on a month on month basis.
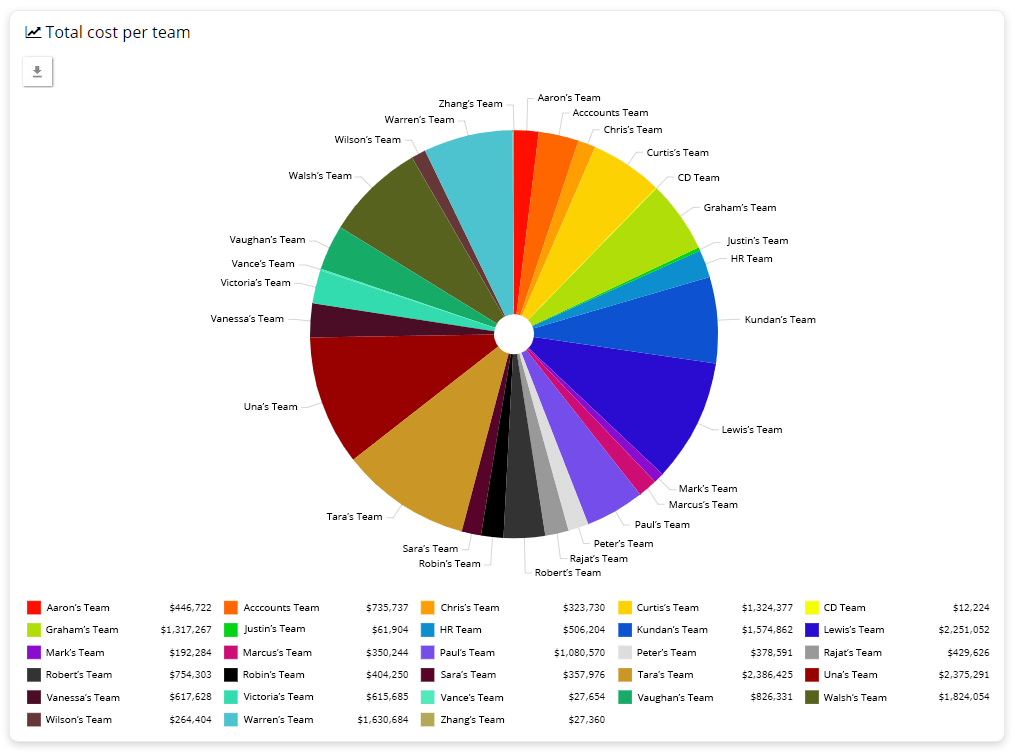
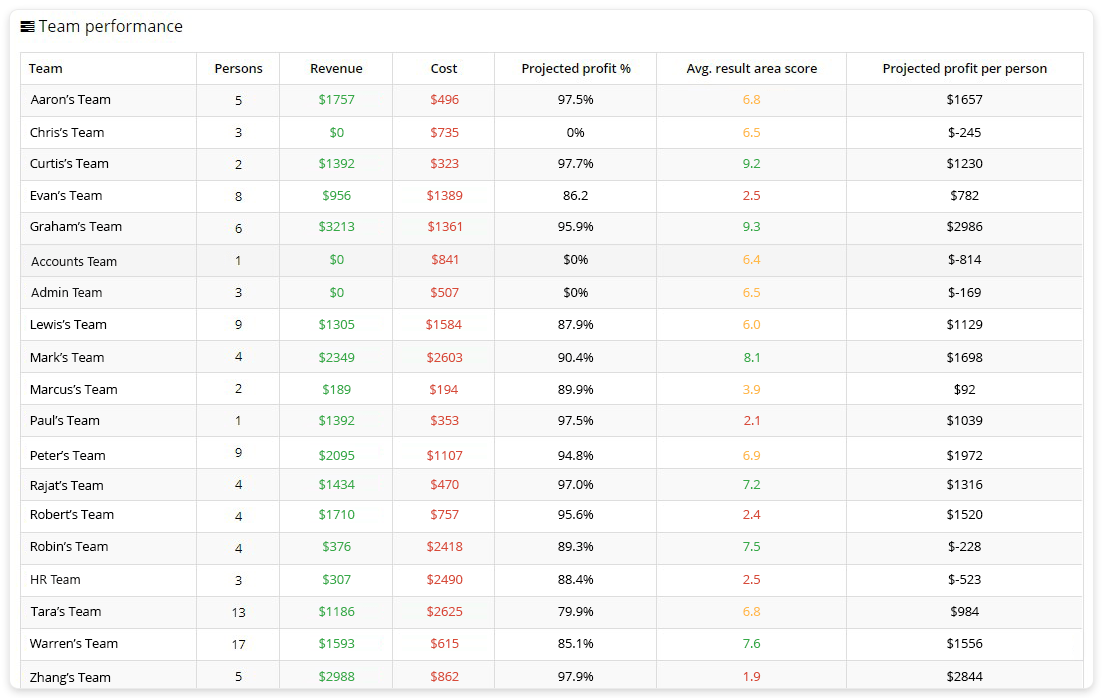
Team profitability report based on projects executed by teams
This report is amongst the most popular on AssessTEAM for computing bonuses and promotions by team. The data here simplifies business decisions by showing you clearly which teams are doing great and which teams are not. The revenue numbers are clearly quantified and the last column gives you a convenient projected profit per person. This report is great for comparing how teams perform in terms of targets achievements in comparison to each other. Some teams excel at meeting targets and some do not, this chart puts it down in the clearest possible terms.
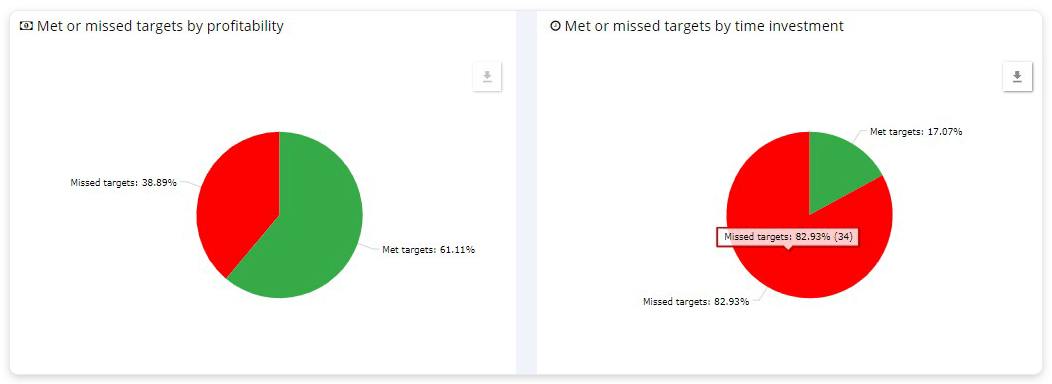
Project summary by targets met or missed
These pies show targets that were missed and met overall in the organization over a period of time. The difference between the pies shows you that your effort estimates may not be accurately entered into the projects. The 2 different pies show you the profitability targets and the time investment target results across the organization.
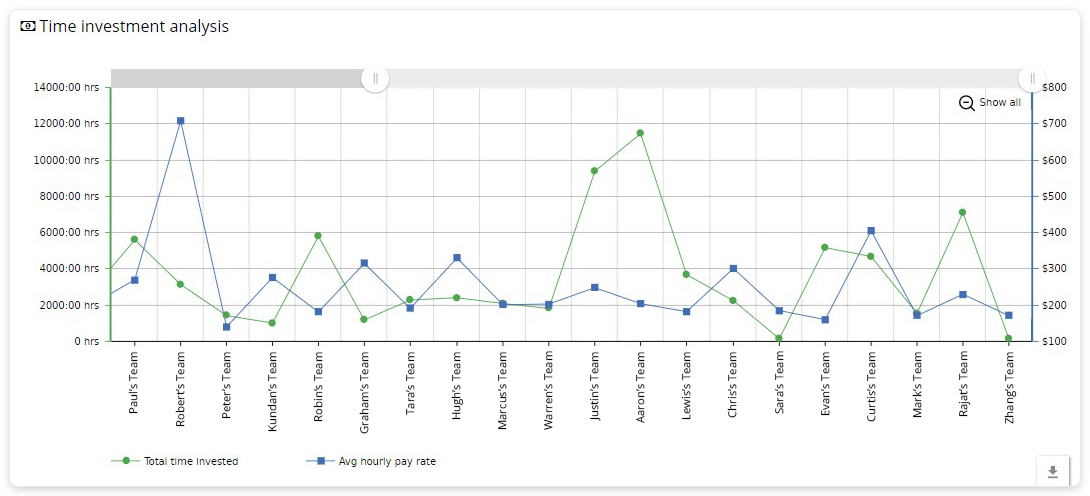
Time investment analysis
Pay rates and time investment differs by teams, this report presents a clear comparasion between the teams in terms of the time they have invested on the projects vs the average pay rate for employees in the team.
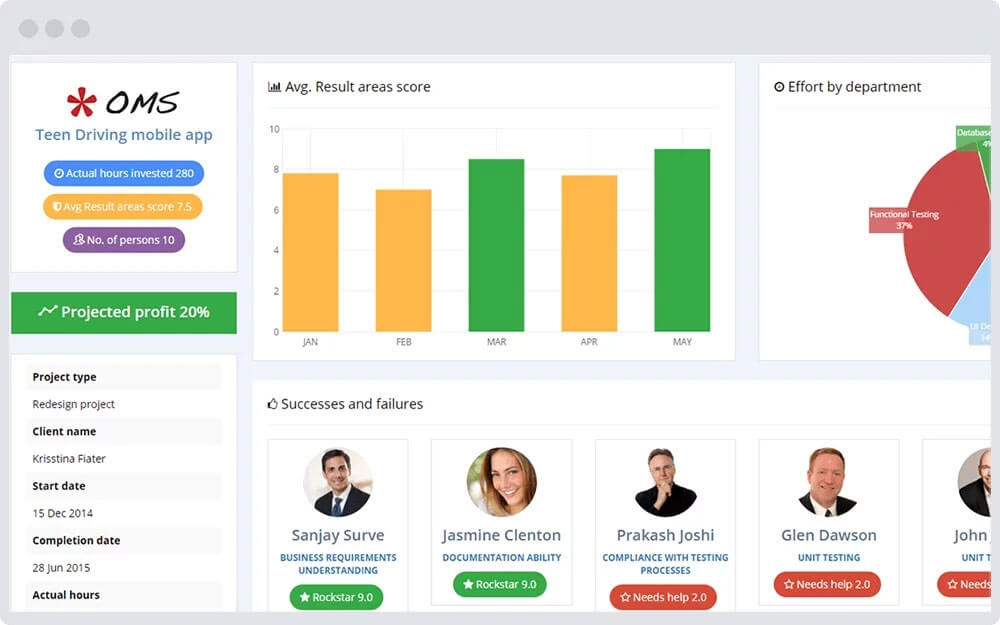
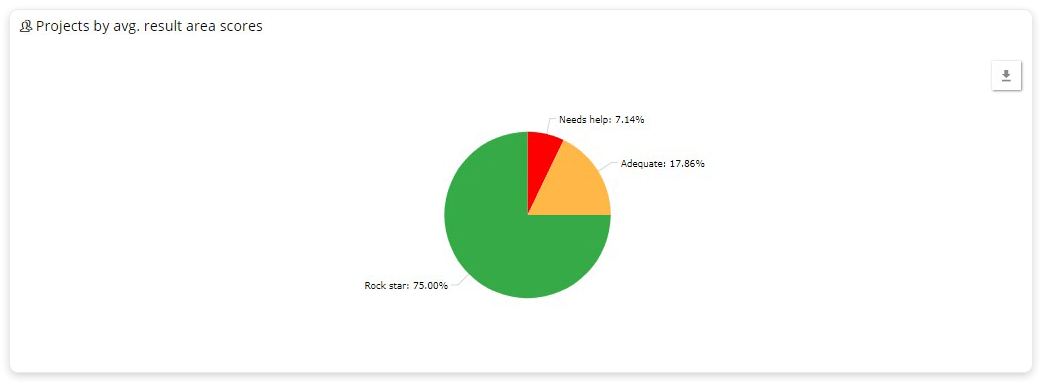
Overall project performance
This simple pie chart shows you how many people were rated high, average and poor on their performance on projects. Clicking the slice will split it up by team names so you can drill down on the problem areas quickly.
Profitability numbers & percentage by project type
Every business delivers a number of different products and services, some types or products and services yield a higher profit and some do not. This report quantifies profitability by product or service type so you can see where your profits are coming from to make bsuienss decisions about marketing and sales efforts. The targets summary and the avg result area scores also shows you how good your teams are in executing each product or service type, this can drive your training and performance management plans.

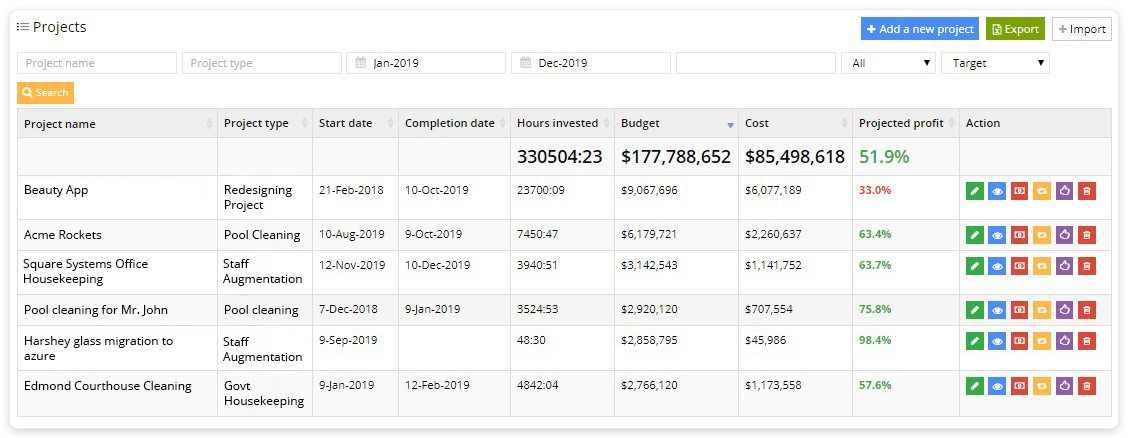
Profitability numbers & percentage by project
This is by far the most frequently used report on the platform, this is used mainly by project managers who keep a daily eye on the project investment vs revenue. Knowing early on that a project is going into risk can help a project manager take remedial measures qucikly.
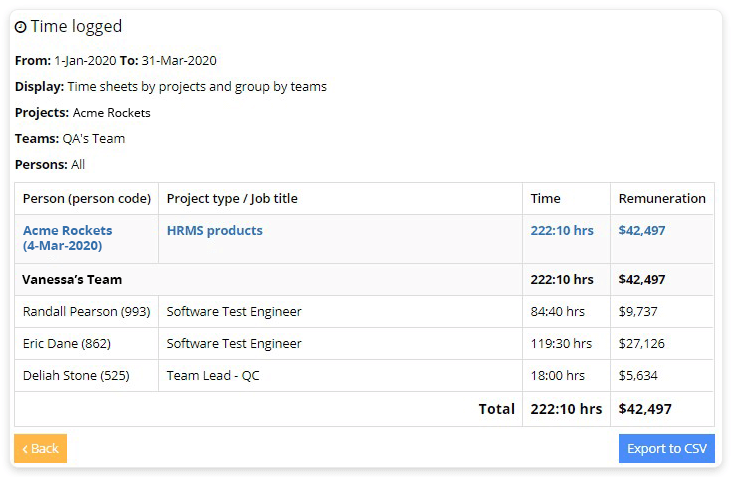
Individual productivity & profitability by project showing time investment by person
This report is ideal when you need to see where the project budget was spent. This shows you the time investment in hours and monetary terms for each person who has worked on the project. An excellent tool to learn from project successes or failures.
These analytical and diagnostic tools can be used to identify issues and to make forward-looking decisions that can improve project profitability.
Using profitability as part of your performance management matrix enables you to add a clear commercial dimension to individual and team performance management. Highlighting and rewarding profitable behavior will not only positively impact the bottom-line but also help avoid personal prejudice.