 XM Knowledge Base

We often need to measure the frequency of behaviors such as how often someone goes grocery shopping, how many appliances someone has purchased in the past year, or how many times someone has gone to the doctor. Yet, behavioral questions can be difficult for people to answer for a number of reasons:
- Recall difficulty. A patient might remember their last check-up at the doctor, but have difficulty recalling whether it happened within the past 12 months or longer ago than that.
- Exact values are not known. Someone is unlikely to know exactly how many times they went to the grocery store in the past year because that is not something we keep a tally of.
- The frequency varies. For example, if you ask a doctor how many patients they see per week, the answer will likely vary depending on whether it’s flu season or another time of year.
- Social desirability. People are reluctant to provide answers that make them look bad – that they never exercise, or they watch more than 20 hours of TV a week.
We provide two key strategies for writing behavioral questions that respondents can answer easily and accurately.
Consider adding a reference period
For questions that ask about behaviors, respondents’ answers are usually more accurate and reliable when the question includes a clearly defined time period. Examples of reference periods include “In the past 12 months,” “In the past 30 days,” or “In a typical week.”
You should use a reference period as short as possible to meet your needs.
If the reference period is too long, recall becomes a problem and people may report fewer behaviors than actually occurred because they forgot. For example, the question, “In the past 12 months, how many times have you been to the grocery store?” would be difficult for people to answer accurately. Rather than recalling each trip to the grocery store, they would likely provide an estimate, “I go about twice a week, so 100 times.” Making respondents do math to answer questions is burdensome. Instead, tailor the response category to the question.
On the other hand, if your reference period is too short (How often did you go to the grocery store in the past 7 days), you will miss people who shop less frequently – once every 10 days or every 2 weeks – and your insights will be off.
For grocery shopping, a 30-day reference period is ideal. It’s short enough that people will generally be able to recall, but long enough to capture most people on the lower end of the scale. The ideal reference period will depend on the specific behavior being asked about.
What if it is important for you to measure a behavior over a specific period, say 12 months? In that case, calculate that value when you analyze your data. For example, you can estimate how many times people go grocery shopping in a 12-month period by taking the values people provide for the past 30 days and multiplying by 12.
If the behavior being asked about is fairly regular for most people, you can ask about a “typical” time period. For example, “In a typical week, on how many days do you use public transportation to get to or from work?” The “typical” reference period can also be used if you want to know people’s normal behavior and ignore outliers. If the behavior is irregular or varies over time, it can be hard to provide a “typical” value. In that case, it is best to ask about a period in the past (e.g., in the past 7 days).
Reference periods referring to the past should be clearly defined. Opt for precise reference periods such as “past 12 months” instead of “past year.” The phrase “past year” can be understood in multiple ways – some may think it means the past calendar year, some may think it means January 1 until today’s date, and others may think it means the past 12 months. Similarly, use “past 30 days” instead of “past month” and “past 7 days” instead of “past week.”
Choose the Best Response Format
Next, you will have to decide what kind of response options to provide respondents. You can collect either open-ended data or closed-ended data.
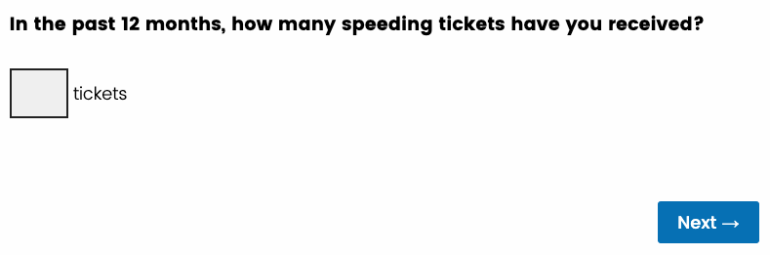
A common approach is to ask for actual numbers using an open-ended format. The benefits are that there are no response categories to bias the respondent and this format allows for the collection of continuous data. Although continuous data is easier to analyze, open-ended questions are more burdensome for respondents to answer and could lead to missing data. The open-ended format is best used when respondents are likely to know or easily recall the specific value.
Pro Tip: Be sure to restrict the input box to accept numerical entries only.
If you do not need precise values, but want to collect continuous data for analytical reasons, consider asking for an approximate value by asking “About how many…” or stating, “Your best estimate is fine.”
Closed-ended questions can be used to reduce respondent burden. Three are three primary ways of asking closed-ended questions about the frequency of behaviors: (a) numerical ranges, (b) approximate ranges, and (c) vague quantifiers.
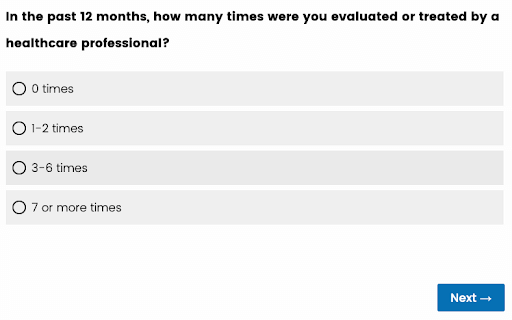
a) Provide a closed-ended response scale with numerical ranges
Numerical ranges are easier for respondents to answer than providing a specific number because they do not have to be as precise. For example, a respondent with a chronic health condition may not know exactly how many times they have been to the doctor. Yet, they may know easily that it has been more than 6 times.
A challenge with closed-ended categories is that the choice of response categories can bias how people answer, especially for when direct memory for the event does not exist and behaviors are irregular (Menon, Raghubir, & Schwarz, 1995). In these situations, respondents often use an anchor and adjust strategy. They assume that the middle category represents the “average” value – that is the anchor – and then they may adjust their response up or down depending on whether they believe they do the behavior more or less than the average.
When known, base response categories around the true distribution of data such that the middle response category is the population median. This will improve the accuracy and reliability of your data.
Also, make sure the specific numerical ranges are sufficient for your analytical needs. When asking about income, for example, it is common to include categories that are at or below the national poverty line to allow for comparisons.
Pro tip: Be sure that the response categories are exhaustive (you have covered all possible categories) and mutually exclusive (no overlapping categories).
b) Provide respondents with approximate ranges
Approximate ranges allow respondents to use a rate-based estimate, which means that respondents do not need to think back and recall each specific behavior. This approach works best when behaviors are regular and when the actual frequency may vary considerably by the respondent.
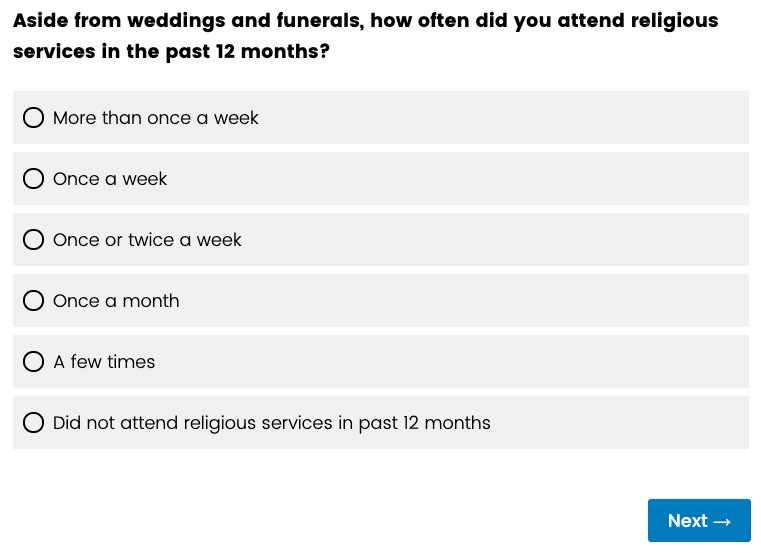
This format can be challenging for a respondent to answer when the behavior is irregular or when the frequency changes throughout the year. For example, imagine a respondent who attended religious services once a week for a few months and then stopped going for the remainder of the year.
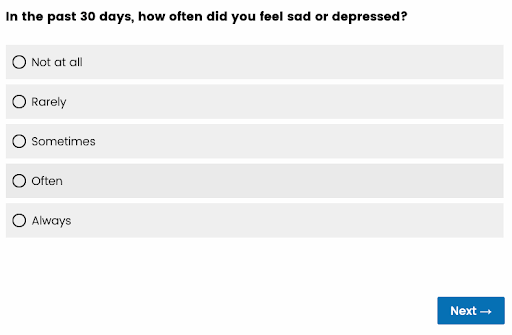
c) Vague quantifiers are another type of closed-ended response category
Vague quantifiers are useful when exact values or rates are unlikely to be known or hard to quantify.
The primary downside to vague quantifiers is that they are subjective. What one person considers to be often may be different than what another person considers to be often. They are most useful when you are more interested in measuring respondents’ perceptions of the frequency rather than the actual frequency.
Another challenge with vague quantifiers is that they can be affected by question order.
Start creating surveys today with our free survey tool