Facing a deluge of data, HR and business leaders must identify metrics that truly impact business outcomes. This article emphasizes the challenge of sifting through vast HR data, advocating for a focused approach. Darwinbox’s HR Analytics Suite offers a solution by prioritizing essential metrics for strategic decision-making. This tool transforms complex data into actionable insights, helping organizations optimize processes, improve decision-making, and enhance competitiveness by focusing on metrics that matter.
The world is awash in data. Every click, swipe, and interaction generates a digital ripple, contributing to a global wave estimated to reach 181 zettabytes by 2025. While this estimation includes all forms of data, the HR function of businesses forms an essential source of business data. As companies continue to accelerate their HR digital transformation, the generation of people data will only increase at breakneck speed. According to Darwinbox’s HR Evolutions Perspective 2023 research, which surveyed 1,500 professionals, 55% of respondents indicated they plan to accelerate the digitization of HR. This digitalization blitz will undoubtedly lead to a surge in HR metrics, threatening to drown even the most data-savvy leader in a sea of numbers.
The metrics chaos
The challenge for HR and business leaders isn't the lack of data but the lack of time. With endless metrics at their fingertips, choosing what to track and analyze becomes a paralyzing task. They need a way to navigate this data ocean, leaving behind the shallows of irrelevant KPIs and diving into the depths of insights that genuinely drive business results.
Imagine a moment, a bustling marketplace overflowing with countless vendors, each hawking their wares. Some offer shiny trinkets, some boast robust tools, and others peddle promises of untold riches. This is usually the scenario when an HR leader or a functional head tries to look at people metrics.
The journey of HR metrics starts as soon as an organization plans and posts a job role. As candidates apply, the number of metrics amplifies, and with each candidate’s progress through the recruitment process, the number of possible metrics keeps multiplying. The company generates large volumes of data throughout the employee life cycle, and those get converted to metrics throughout this journey. However, only a handful of these metrics are of strategic value, and most of the metrics are insightful in conjunction with a few others.
For example, for recruitment and hiring functions within HR, a typical organization can track over 21 different metrics. However, only seven of these are of actual value to the business, and most of these would only be valuable when viewed in conjunction with other HR metrics.
So, how do HR and functional leaders distinguish the nuggets of wisdom from the glittering pebbles of vanity metrics?
To navigate this metric maelstrom, HR, and people leaders need a compass and a clear understanding of the metrics that truly matter. For HR Heads, this compass points towards a holistic view of the talent landscape. Think time to hire, not just a cost per head; quality of hire, measured by retention rates and performance; and candidate experience, gauged through NPS scores and interview feedback. It's about understanding the journey from attracting top talent to nurturing and retaining a high-performing workforce.
But leaders need more than a panoramic view. Functional Heads require a detailed map that illuminates the levers they can pull to drive team success. This map features productivity metrics like output per employee and cycle time alongside employee performance indicators like goal achievement and absenteeism rates. It delves into the heart of team dynamics, measuring communication and collaboration effectiveness through feedback, project completion rates, and conflict resolution.
What matters?
Organizations are constantly pressed for resources, and leadership bandwidth is always in short supply. Focusing on "What Matters?" is essential because it enables organizations to effectively navigate the complexity of today's data-rich environment. By focusing on the most relevant metrics, companies can avoid being overwhelmed by the sheer volume of information and instead concentrate on data that directly impacts strategic decisions and operational efficiency. This approach ensures resources are allocated wisely, efforts are directed towards actionable insights, and ultimately, enhances the organization's ability to achieve its objectives. Identifying and prioritizing critical data points streamlines processes, sharpens strategic focus, and fosters a culture of informed decision-making, underlining the significance of distinguishing the essential from the cursory in the quest for business success.
Across HR functions, there are a bunch of KPIs that matter. Let’s look at a few metrics categories:
Compensation and Benefits: Compensation and benefits metrics, such as Compa-Ratio, Pay Equity Ratio, and Merit Increase Rate, are vital for ensuring fair and competitive compensation practices. They help organizations maintain alignment with market rates, foster pay equity across all demographics, and reward performance effectively. These metrics are crucial for attracting and retaining top talent, promoting a culture of fairness, and driving employee motivation and satisfaction.
Employee Engagement and Satisfaction: Employee engagement and satisfaction metrics, including the Employee Satisfaction Index (ESI), Employee Engagement Score, Turnover Intention Rate, Absenteeism Rate, Employee Well-being Score, Job Satisfaction Rate, and Work-Life Balance Score, are crucial for understanding the health of an organization's culture and its impact on performance. These metrics provide insights into how emotionally invested and committed employees are to their organization, their level of contentment with their job roles, and their overall physical, mental, and emotional health. High scores in these areas often correlate with increased productivity, lower turnover rates, and a more positive work environment, underscoring the importance of monitoring and improving employee engagement and satisfaction to foster a supportive and effective workplace.
Employee Turnover and Retention: Understanding metrics like Turnover Rate, High Performer Turnover Rate, Regrettable Turnover Rate, and New Hire Turnover Rate is essential for businesses to assess their employee turnover and retention health. These indicators not only highlight the overall rate at which employees leave but also provide a nuanced view of turnover among top performers and those losses a company most regrets. Tracking turnover among new hires can also identify onboarding and early employment issues. Together, these metrics inform retention strategies, helping to reduce turnover costs and preserve organizational knowledge and culture, which is vital for long-term success and competitiveness.
Learning and Development: Focusing on metrics such as the Training Effectiveness Score, Learning Completion Rates, Average Time to Competency, and Cost of Training per Employee is crucial for businesses to ensure their learning and development (L&D) initiatives are both practical and efficient. These metrics help evaluate whether training programs meet their intended objectives, employees' engagement and commitment towards learning, the speed at which employees gain necessary skills, and the financial investment in developing talent. Optimizing these areas enhances employee capabilities, aligns skill development with organizational goals, and ensures a strong return on investment in L&D efforts.
Performance Management: Measuring metrics under the performance and productivity category, such as Performance Rating, Goal Completion Rate, 360-degree Feedback Score, and Overtime Hours, is critical for businesses to assess and enhance their workforce's output and efficiency accurately. Performance Ratings and Goal Completion Rates offer quantitative insights into individual and team achievements against set benchmarks, enabling targeted improvements. The 360-degree Feedback Score provides a holistic view of an employee's performance from various stakeholders, promoting a more comprehensive development approach. Monitoring Overtime Hours helps identify workload balance issues and productivity bottlenecks, ensuring employees remain productive without risking burnout, thus maintaining a healthy and efficient working environment.
Recruitment and Hiring: Measuring recruitment and hiring metrics such as Time to Fill, Time to Hire, Quality of Hire, First-year Attrition Rate, and Hiring Manager Satisfaction is essential for enterprises to streamline their talent acquisition processes and ensure they attract and retain the best candidates. Time to Fill and Time to Hire provide insights into the efficiency of the recruitment process, helping organizations identify bottlenecks and improve candidate experience. Quality of Hire and First-year Attrition Rate are critical for assessing the long-term impact of hiring decisions on organizational performance and culture. Meanwhile, Hiring Manager Satisfaction offers valuable feedback on the recruitment process's effectiveness and alignment with departmental needs. Together, these metrics enable enterprises to make data-driven decisions that enhance their competitive edge in the talent market.
Darwinbox Analytics Suite to the rescue
Metrics can be a map to reach business success. However, a map alone is not enough. Leaders need a skilled guide, someone who can interpret the intricate symbols and translate them into actionable insights. This is where Darwinbox’s intelligent HR Analytics Suite steps in, powered by the magic of AI and machine learning. Darwinbox interviewed over 850 customers to identify the top priority metrics important for HR and Functional leaders. These metrics are now culled into Storyboards, which is our vision of how metrics should be utilized.
Wondering what is a storyboard?
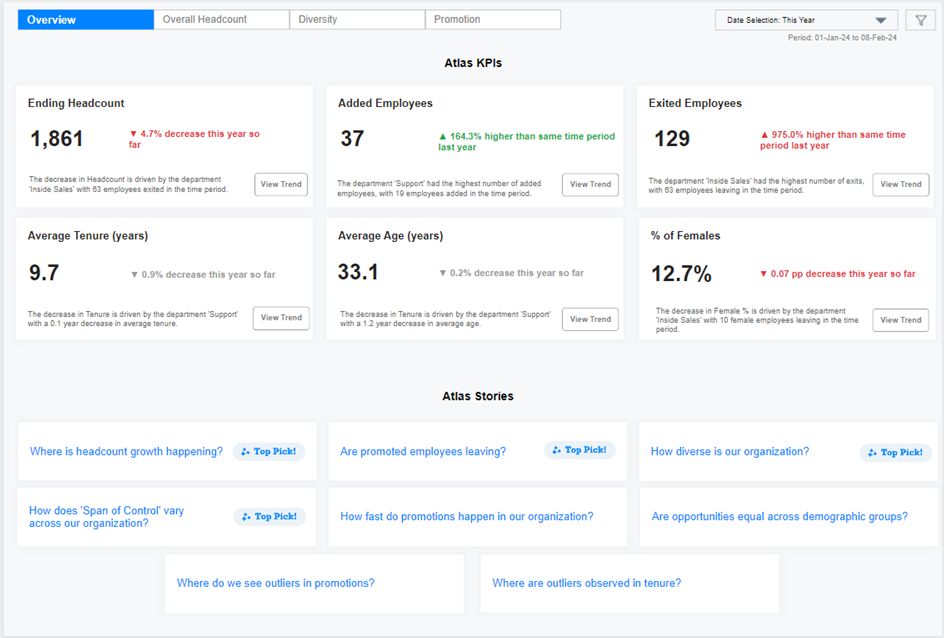
Individual metrics in isolation aren’t of much value to HR and Functional leaders. To help them get actionable information from HR analytics, Darwinbox has developed Storyboards. The storyboards use a multi-metric approach to answer specific business questions for business leaders. Through in-depth research with our customers, Darwinbox has identified over 100s of questions that are built right out of the box, ready to help CHROs and Business Unit Heads to make strategic business decisions. See Figure 1; the dashboards give a bunch of top-pick questions that the user can choose from and get an instant insight-backed answer.
Figure 1 – Darwinbox Storyboard – Home Screen
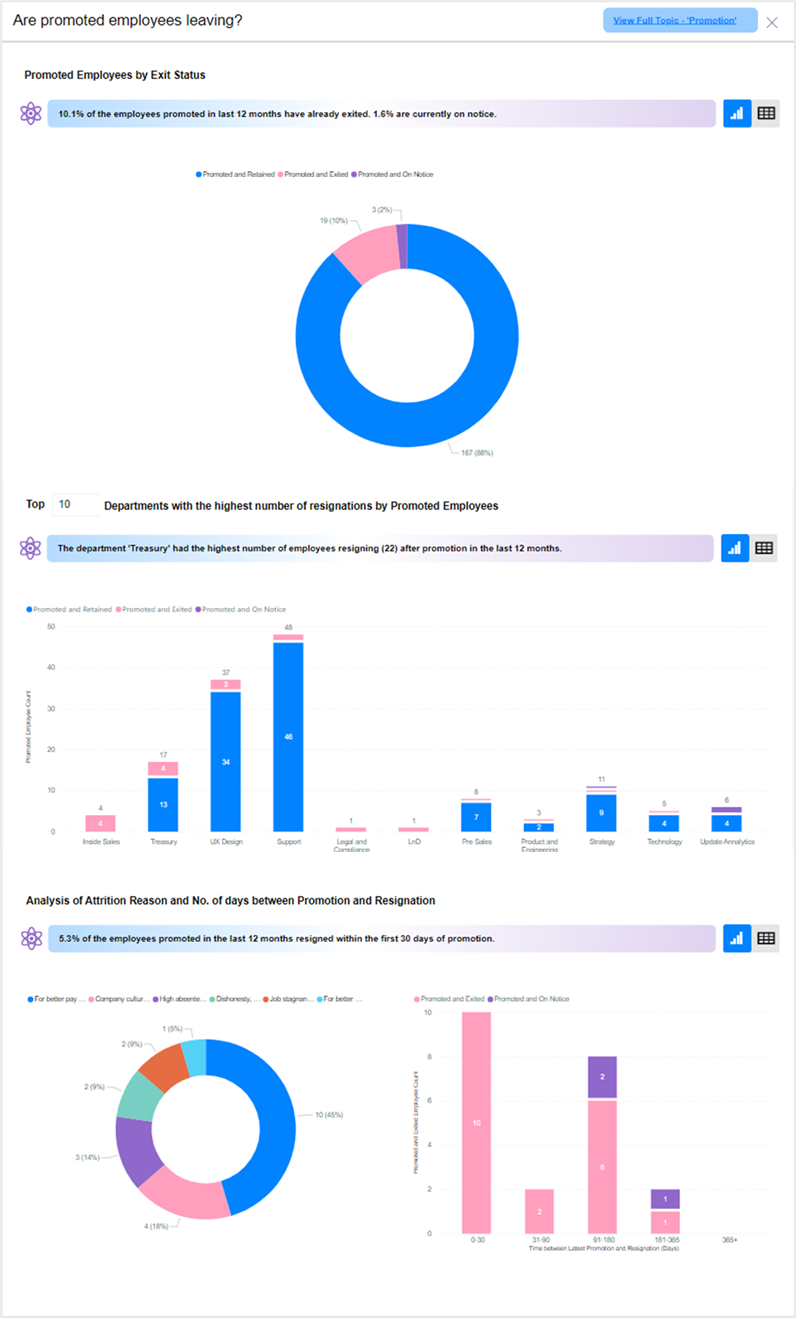
Imagine a system that understands your unique needs and automatically surfaces the most relevant metrics based on your role, industry, and past data analysis. It's like having a personal data sherpa leading you through the treacherous mountain passes of information overload and pointing you toward the peaks of actionable insights. For example, see Figure 2, which answers the question, “Are promoted employees leaving?”. It uses relevant metrics from different departments, levels, and roles to provide a simplified visual answer. In this case, the HR leader will not have to look at several dashboards or metrics to derive the answer. The tool answers the question and provides the necessary data along with the answer.
Figure 2 – Storyboard Question Example – ‘Are promoted employees leaving?’
The storyboards coupled with AI powered system offer a suite of tools that empower leaders to prioritize key metrics, saving them precious time and effort. Interactive dashboards and reports transform complex data into clear visuals, revealing trends and patterns that would otherwise remain hidden. Predictive analytics, fuelled by AI, anticipate potential problems, and suggest proactive solutions, keeping leaders ahead of the curve. And the best part? Seamless integration with other HR systems enables leaders to take immediate action based on their data-driven insights, turning knowledge into power.
For example, if a CHRO wants to evaluate their company’s DEI initiative outcomes. The storyboards are equipped to answer questions such as, does my organization create and inclusive space for my workforce? Or what percentage of underrepresented talent was hired into the organization? Is it better or worse compared to last year?
The Future is Now
This data-driven future is not a distant utopia; it's a reality within reach. By embracing Darwinbox’s intelligent HR solutions and focusing on the right metrics, HR and functional leaders can transform from data-drowning victims to data-driven champions. It's about making informed decisions about talent acquisition, development, and performance, all based on real-time, actionable insights. It's about unlocking the full potential of your workforce and propelling your organization to new heights of success.
So, don't let the data deluge drown you. Take the first step today and equip yourself with the tools and insights to navigate this data ocean and lead your people to success. Remember, in HR, the right metrics are your compass, your map, and your guide to thriving, engaged, and productive.
Additional resources


Speak Your Mind