What You Might Have Missed from DecisionWise
- If you want to give your employee experience a boost without spending a lot of money or implementing something complicated, we’ve got a simple and effective plan for you. Check out this infographic to create a simple employee experience plan using EngagementMAGIC®.
- We’ve had some exciting changes at DecisionWise, check them out in this post where we also included a fun fact about each employee who had a job role change!
- Thanks to our local art museum, we got to continue our tradition of flower planting and beautifying our community.
- Ever wanted to advocate for an employee listening program but you’re not quite sure what to say? This guide will give you three simple conversation starters to advocate for employee listening.
- The Real Reason Employees Disengage isn’t what you might think it is.
- Get Unstuck and Stop Procrastinating With These Podcasts featuring DecisionWise CEO and author of Swipe: The Science Behind Why We Don’t Finish What We Start
- DecisionWise employees are putting out some great content! Check these out:
Come See Us at SHRM
DecisionWise will be in Vegas! Join us at the SHRM conference in Las Vegas, June 11-14th! Visit booth #4439 for tasty treats, exciting giveaways, and a chance to win a free 360 coaching certification and a $25 gift card. Let us know if you’re attending by filling out the form below. We look forward to seeing you there!
Featured Discussion
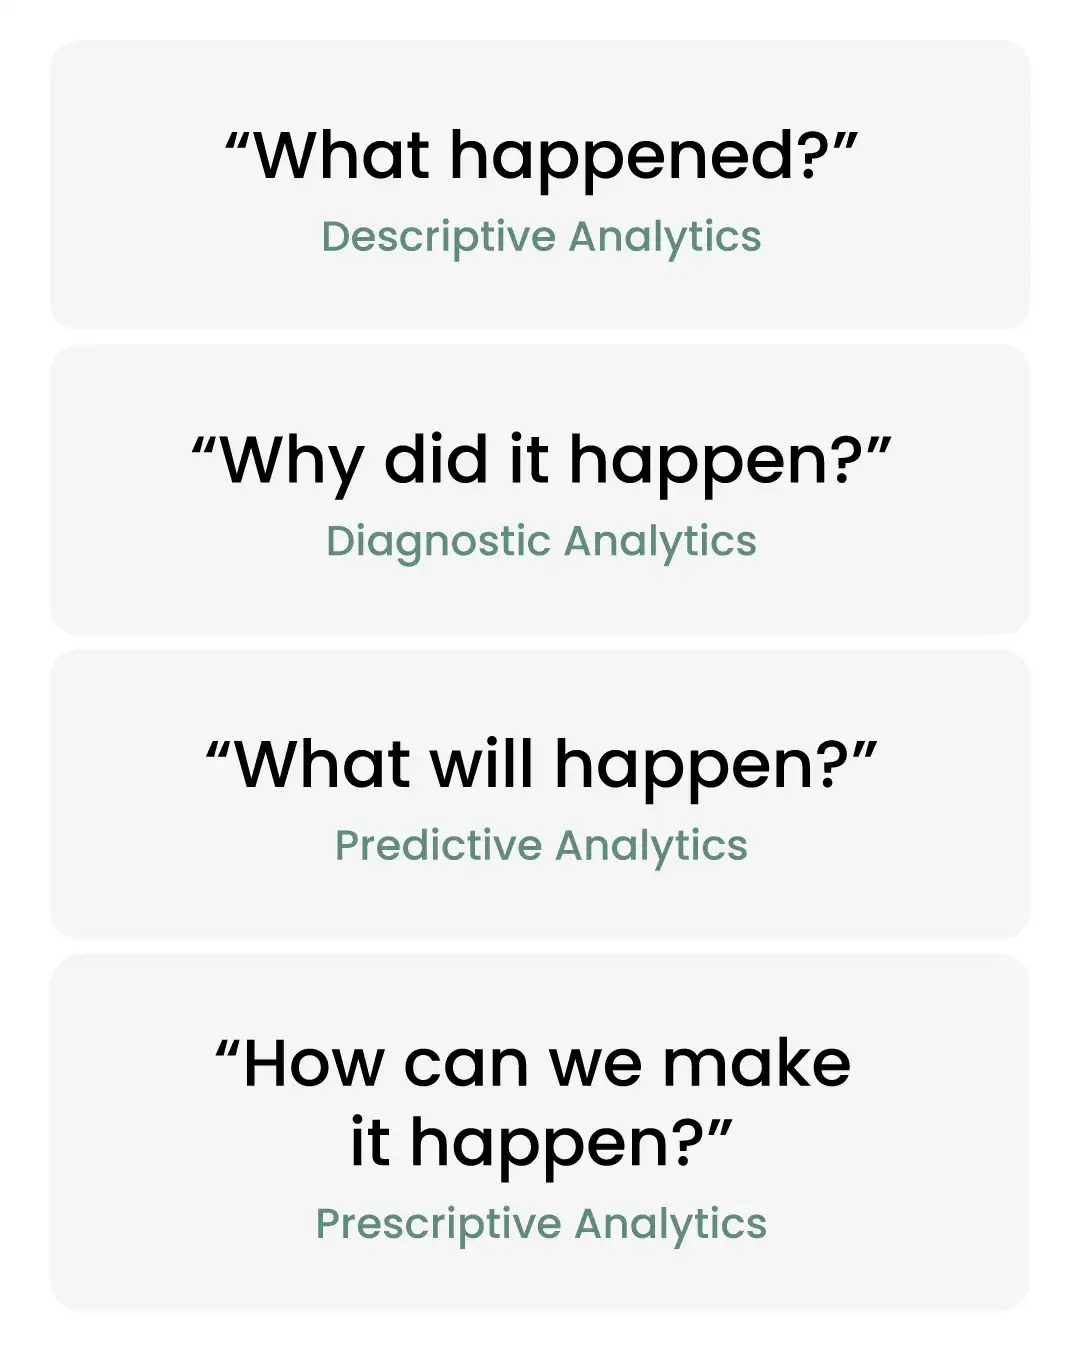
Descriptive Analytics: What happened
Most of us are familiar with the mundane task of data reporting. We diligently track basic metrics like net new hires or the number of employees who left the organization in the last quarter. We may even know how many people participated in our last employee survey. But let’s face it, those reports only tell us “what” is happening, leaving us in the dark about the elusive “why.”
Diagnostic Analytics: Why did it happen
Reporting can tell us what is happening, but analysis is the key to understanding why it’s happening. It’s time to take our people analytics function to the next level and uncover the stories hidden within the data.
Our first step is to find meaningful relationships between different data points. These relationships are like building blocks, forming the foundation of insights. Imagine discovering that an employee’s commute length has a direct impact on their likelihood to quit. Armed with this knowledge, we can make informed decisions.
By diving deep into our data, we are abandoning guesses and “gut instinct” and tapping into a world of interconnected behaviors and actions. For instance, have you ever wondered if employee productivity soars or plummets during the months when the World Cup Soccer is played? With data analysis, we can find out!
This graphic illustrates how the data-gathering process might flow in a common HR environment.
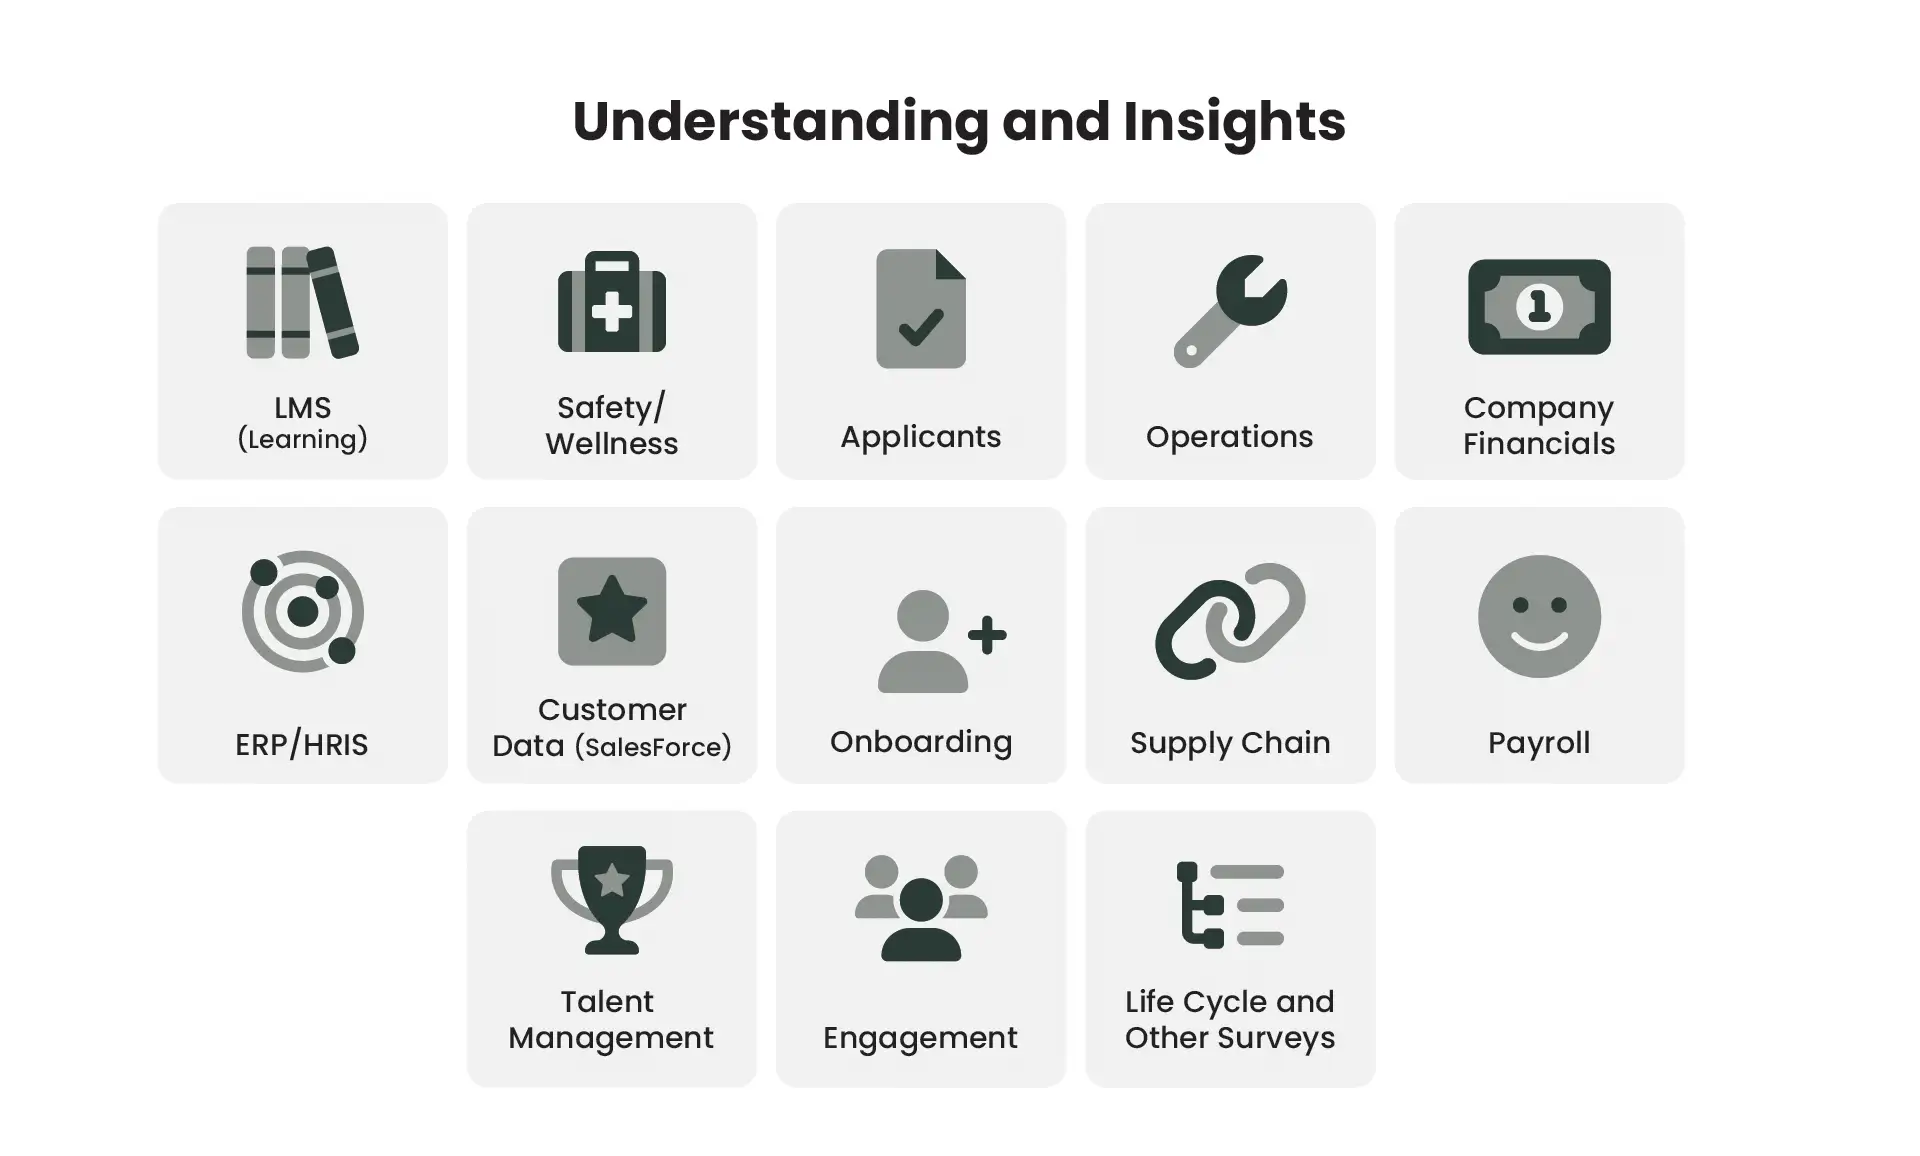
All this information, however, doesn’t just flow naturally into understanding and insights. It must be transformed and studied. Studying and transforming data lies at the heart of data analytics.
This graphic diagrams a typical progression when performing data analysis.
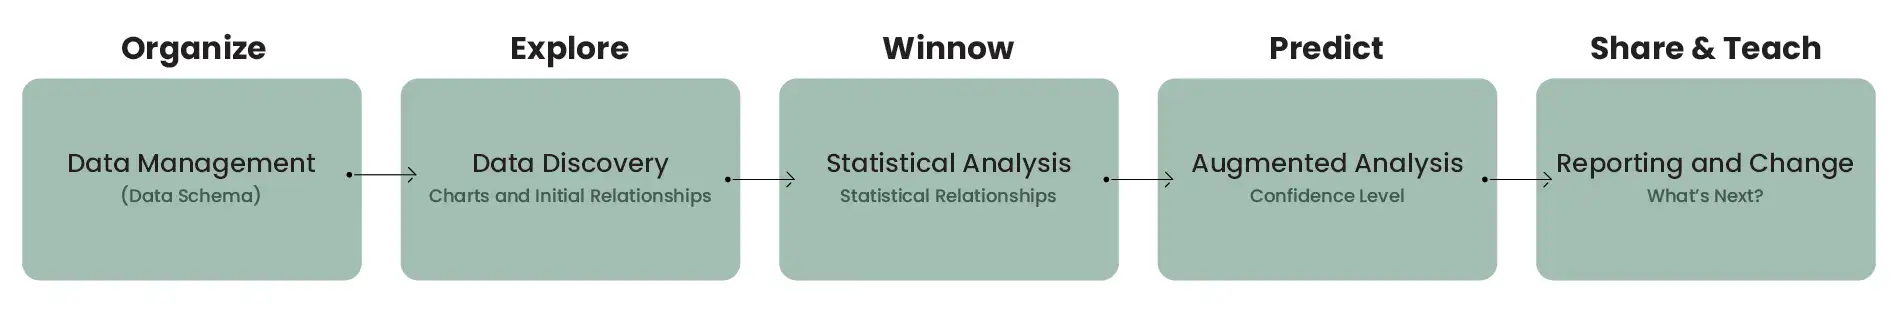
We start by organizing the data, creating a structured canvas for analysis. Then, we unveil basic relationships through captivating charts and tables. For example, tables show basic relationships, such as the number of women in an organization’s software engineering department.
Once we have collected and sorted through the more common relationships we might find, we further refine them (winnowing or narrowing). For example, we may discover from a table that we have more female employees than male employees in HR. Is that difference meaningful or is the difference simply a product of chance? That’s where statistical analyses come into play, helping us answer that question. If the difference is not merely a result of chance, then we can start asking why that difference exists. Does our recruiting skew towards women? The answers are within our grasp.
Predictive Analytics: What will it happen
Once we have mastered statistical analyses, we venture into the realm of advanced models that boost our confidence in the relationships we’ve uncovered. This is when we start using machine learning and AI, amplifying our discoveries and unveiling new connections yet to be found. We can even begin to predict what might take place.
Here’s a simple illustration. If we have a very good understanding that employees who possess a certain educational background succeed in our organization, we can use that insight to predict who might succeed during the next round of promotions.
But here’s the catch: to make analytics truly predictive, we need an abundance of data points. Here’s another case study: if we only track age, gender, and work location, we can’t accurately predict which employees will leave the organization after one year. We need a multitude of relationships to explore. Maybe women leave more often, but we don’t know what’s causing it because we don’t have the right data. By tracking variables like commute time, job tenure, job shift, tenure with a manager, age, last promotion date, pay grade, and more, we open up a world of possibilities.
To summarize, the following graphic explains how the analytical process works as we advance through our tools.
This illustration presents a common people analytics maturity model.
Where are you at in your data analytics continuum? Are you stuck in reporting? Then it might be time to build a plan to move up the data analytics maturity model and into analysis.
Contact us for more information. We have consultants ready to help you achieve your people analytics goals.
What’s Happening at DecisionWise
UPCOMING WEBINAR
![]()
Join us for an engaging webinar on organizational culture, designed exclusively for those passionate about enhancing employee experience. Discover how culture impacts engagement and overall business success.
At DecisionWise, we understand culture’s critical role in shaping identity, attracting top talent, and fostering a supportive environment.
Let Christian Nielson and Matthew Wride guide you in defining, assessing, and building an engaging culture. Empower managers and embed culture in HR practices for thriving workplaces.
Register now to learn from our expertise and create a culture that drives success.
Secure your spot today!
HR News Roundup
- Why are people analytics skills still lacking in HR?
- Four-day workweeks – ‘We tested it, and here’s what we found…’
- What Is Recruitment In HR And How Does It Work?
- How Do Pacesetter Companies Outperform Their Peers? They Are “Architected for Change.”
- Unlocking Employee Well-Being: The 5 Essential Elements to Focus On
- Job Satisfaction at a High Thanks to Work/Life Balance Strides