U.S. employers spend billions of dollars each year on training and education expenditures. So, it’s no wonder that chief executives expect to see results when it comes to the ROI of a workforce education program.
As HR leaders, it is our responsibility to clearly align employee education initiatives to proven business and social outcomes. This justifies the investment to leadership and ensures that employees reap the benefits. We’re also constantly asked to prove a program’s effectiveness. That’s where having data that demonstrates program results is important. However, knowing where to start can be a formidable challenge.
As chief people and legal officer at InStride, a tech-enabled services company that delivers workforce education solutions, I’ve had the opportunity to track key insights on workforce education efficacy internally as well as externally at our corporate partners. Based on my learnings, here are 10 key metrics to track in 2024 so you can confidently answer the question: Is workforce education worth the investment?
10 must-know metrics in 2024
1. Program take rate
Percentage of eligible employees participating in the program
Understanding the program take rate helps organizations allocate resources. If the take rate is low, it likely indicates that either the organization is not effectively marketing the program internally or it has put in too many barriers to participation (e.g., clawbacks, waitlists, etc.).
In contrast, a high take rate can signal that the program is resonating with employees and justifies continued investment. For traditional tuition reimbursement, topping 2% is considered a high take rate, whereas for more modern direct-bill programs, aiming for 5-10% participation is achievable and desirable.
2. Employee retention rate
Retention of participating employees, compared to non-participating employees
Employee retention is a top priority for most organizations. Fortunately, investment in your employees tends to lead to investment back into the organization. For InStride partners, we typically see retention rates top 90% for participating employees compared to the low 60% range for non-participants. This measurement can help you spot trends and patterns, especially if retention rates are coming in lower than expected.
For example, lack of opportunities for advancement is one of the top reasons employees leave a job. At InStride, we have identified that employee retention rates can be improved by offering career path planning that provides training and development opportunities, often resulting in talent mobility.
3. Education program attraction rate
The number of applicants or new hires who identify the education program as a reason they joined the organization
Assessing how potential candidates view workforce education opportunities can help companies develop their marketing and recruitment strategies. You can obtain this number by performing new-hire surveys that ask how heavily they weighed workforce education as a reason for joining the organization. Positive perceptions attract top talent who value opportunities for learning and growth. In fact, 70% of U.S. employees say they’re at least somewhat likely to leave their current company and accept an offer with a new company that’s known for investing in employee learning and development.
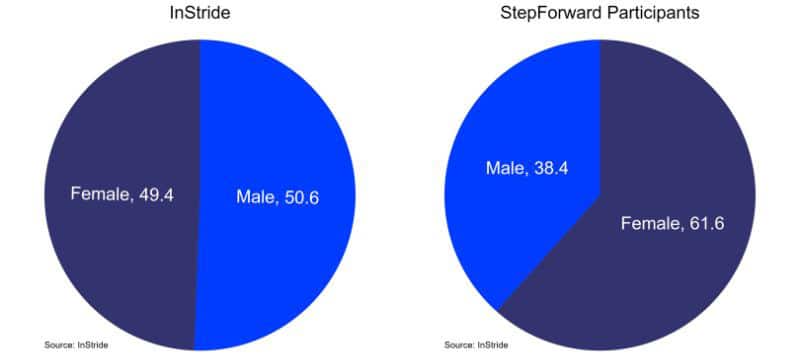
4. Participant demographics
Gender, ethnicity, age, educational background, salary level, manager vs. individual contributor and more demographics are all valuable to help achieve organizational goals.
Data based on this information can enable organizations to create more inclusive and effective workforce education programs that meet the diverse needs of their employees. In particular, low rates of utilization from lower-wage employees or diverse staff would be cause for concern and course correction. Collecting and analyzing demographic data needs to be done in compliance with privacy regulations and used only for program improvement and support purposes.
See also: Need to improve your training? 5 ways AI can help
For instance, at InStride, we track participation by gender in our workforce education program compared to our overall workplace. Knowing that female participants in our education program, Step Forward, significantly exceed their proportion in the workplace is a valuable insight as we conduct internal planning around our leadership talent pipeline.
5. Completion rate
The number of learners who finish or graduate from a learning program
Having clear insights into how many learners complete programs is essential for assessing success, allocating resources effectively and improving participant satisfaction. For instance, if many employees drop out of certain types of programs or from particular academic institutions, efforts may be needed to uncover the reasons why they don’t continue and address concerns.
To increase completion rates, organizations can implement employee-learner support services (balancing work and education is difficult for anyone), manager training (a supportive manager is key to completion rates) and regular assessments of program relevance and employee engagement.
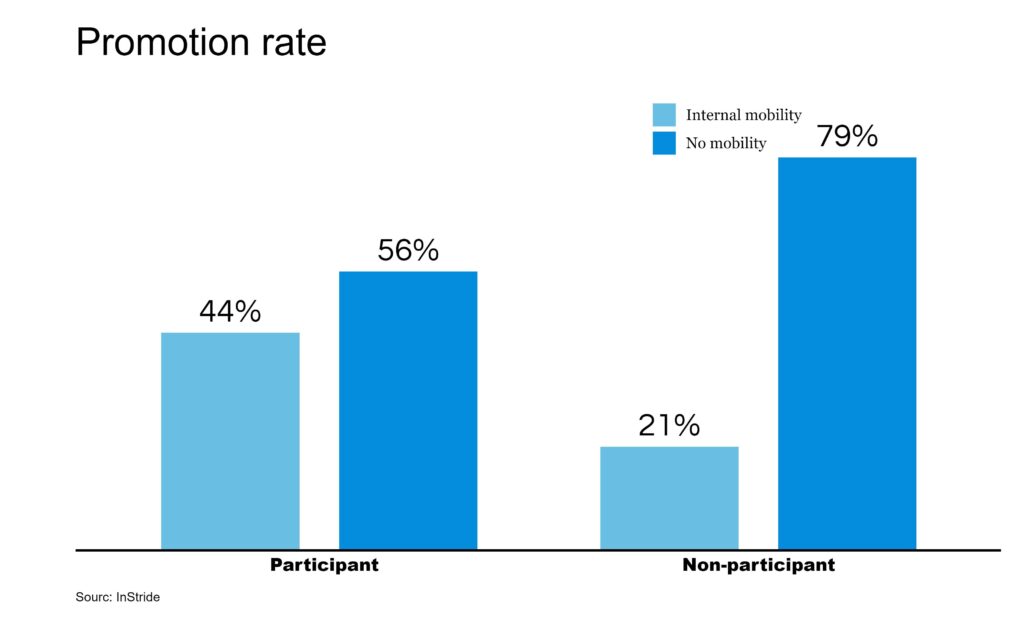
6. Promotion rate
Career progression and internal mobility of program participants, either vertically or horizontally, over time
A high rate of promotions among program participants validates the value of continued learning among employees. Internal career advancement ultimately leads to more engaged and motivated employees with higher job satisfaction and commitment. Organizations typically see two to three times more promotions among participants of workforce education programs. Implementing career education paths—education options mapped to in-demand roles at the company—can help maximize promotion rates while filling high-need roles internally.
Just as with our corporate partners, we also see this trend internally here at InStride, where participants in Step Forward, our own workforce education offering, earn promotions at approximately two times the rate of their non-participant peers.
7. Employee experience
Self-reported employee engagement with the program, program satisfaction and employee sentiment
For employee experience, a best practice is to leverage a variety of information-gathering methods (such as qualitative and quantitative) at different stages in the employee lifecycle. Qualitative methods can include one-on-one conversations and surveys. These surveys can help unearth other trends or challenges that solely data-driven approaches can miss.
8. Budget/ROI
Measurement of the benefits that a company gains from investing in workforce education for its employees
Review and extract spending activity to ensure program costs are on track with the budgeted spend, as well as calculate ROI metrics in connection with program outcomes. By assessing ROI, companies can ensure that their education programs contribute to their strategic goals and deliver measurable benefits to both employees and the organization as a whole.
Critically, a successful education program should grow over time and engage as many participants as possible. However, a growing program means a growing investment you need to justify to your CFO.
The best way to manage this is to work with your finance team in the early program stages to develop internal measurements that attribute value to changes in talent retention, promotion rates, employee productivity, employee engagement and workforce resiliency. Typically, strategic workforce education programs can yield $2-$3 for each dollar spent, but tracking impact is critical to validate that investment.
9. Participant productivity
Specific employee productivity values, such as sales, outcomes and performance ratings
Monitor this metric for participating learners, comparing average values against those of non-participating employees. Also, track employee productivity and success during and after the time that they’re actively engaging in learning opportunities.
For example, suppose there’s an individual who recently completed a professional certification program that’s directly tied to their current role. Has their performance improved since earning the certification? For one InStride retail partner, program participants saw a 10% increase in closed sales compared to non-participants.
10. Tuition/debt savings
Aggregate impact for the life of the program, assuming learners would otherwise need to finance their education
Over the past decade, the U.S. student loan debt balance has increased by 66% and now totals more than $1.77 trillion. The bottom line is workforce education helps employees avoid the crippling burden of tuition costs. As an organization, your contribution to this social issue should be recognized both internally, during your annual meetings and employee communications, as well as externally, in ESG reports and earned media coverage. Tracking and demonstrating how you are preventing your employees from accruing student debt is critical to achieving this well-earned recognition.
Elevating workforce education: The data-driven approach
Today, when tasked to do more with less, HR leaders need to be strategic about their investments. This means taking a modern, data-driven approach that up-levels learning from a cost center to a strategic lever. Monitoring these 10 key metrics is a tangible way to gain actionable insights that can make a stronger, positive impact on your workforce and business in 2024 and beyond.