

CHART OF THE DAY: Your semi-regular labor market update
 Steve
SteveTwo quick charts on my favorite CHART OF THE DAY topic - the trends in macro labor force dynamics in the United States.
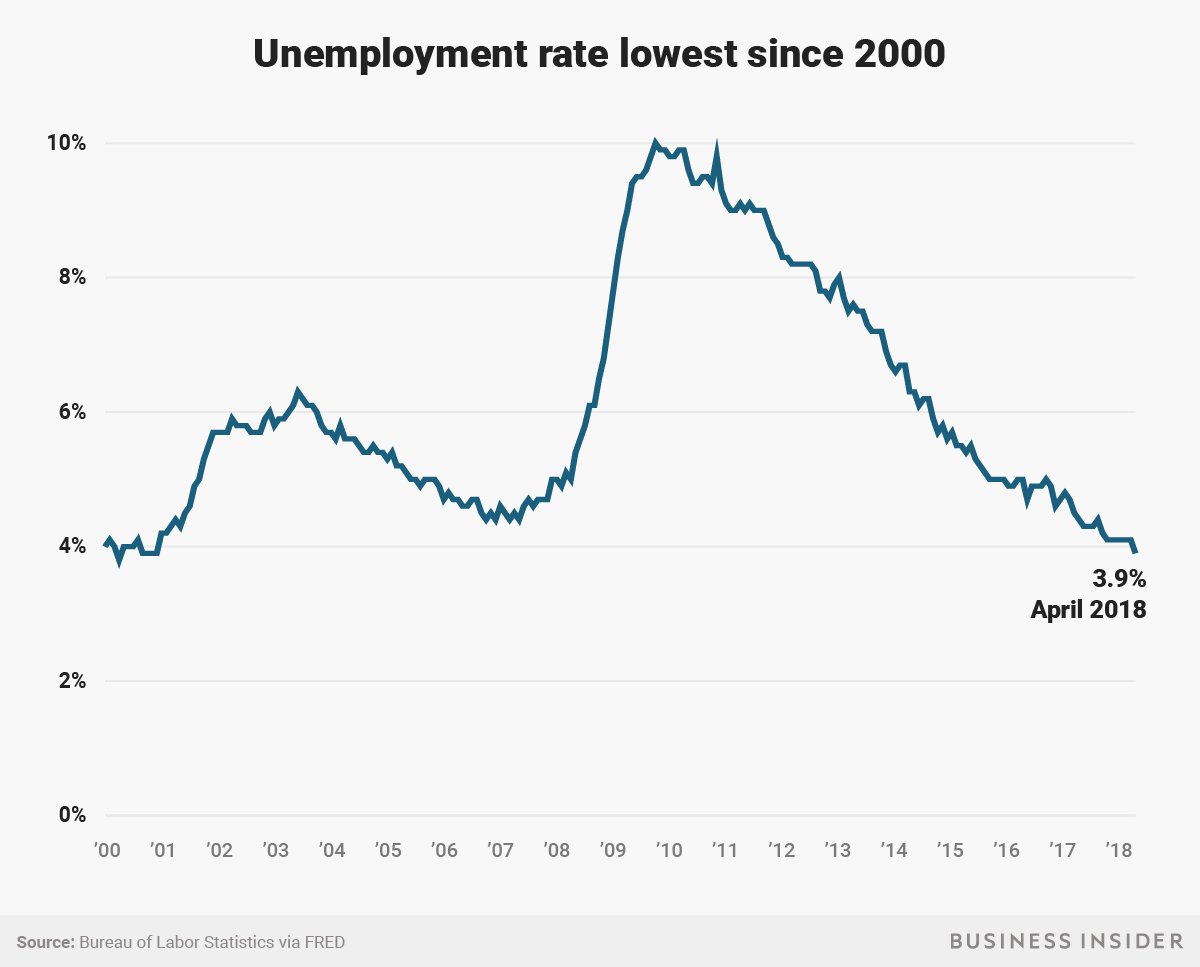
First, the big headline from a few days ago, the official unemployment rate in the US dipped below 4% for the first time since late 2000, ( was the ) hitting 3.9% as of the end of April 2018.
For a look at this headline trend, see the below chart from our pals at FRED:
And while this dip below 4% for the first time in almost 20 years was what most reports about the state of the labor market honed in on, (and probably rightly so), the 'truth' of the health of the labor market usually resided in other metrics. Like, for example, one of my favorites - the length of time it takes organizations to fill an average open position.
Here's the latest on that - from the DHI-DFH "Mean Vacancy Duration" data (the latest I could find on this is from the end of February 2018).

While you can see some upticks and downticks in the average time to fill, the trend since the end of the recession in 2009 is clearly up and to the right - meaning it continues to take longer and longer for most companies to fill open jobs. Officially, the mean vacancy duration for February 2018 is at 28.9 working days - essentially over a month to fill any open job.
If you did into the details of the report, (and I did, since I am a weenie), one number really stood out. It now takes over 21 working days to fill roles in the hospitality and retail sector - think hotels, restaurants, fast-food, retail stores. That number is up dramatically from its 'bottom' of about 14 days just a few years ago. You would think that these roles should be the easiest to fill, and maybe they still are, but even today's easy roles to fill are taking longer and longer to actually be filled.
There is more to this story, and I need to take some time to look at what is happening with wage data, labor force participation, and the openings and quits rates, but these two charts and their data are both pretty revealing.
It's probably a good time to be a job seeker, all things being equal.
And it is also a good time to be a recruiter - a good one anyway, because your value to organizations keeps growing.
That's it from me - have a great day!

Reader Comments