Remove 2003 Remove Data Remove Productivity Remove Retention and Turnover
article thumbnail

Curbing Employee Turnover Contagion in the Workplace

Visier

The deadly 2002-2003 SARS outbreak remained an epidemiological mystery for over a decade. Turnover Contagion: Tracing the Source. It’s also a lesson for HR leaders looking to treat a viral event of a different sort: turnover contagion. An increase, then, of turnover by just 1% in a company of 30,000 employees can cost $32.9

article thumbnail

How Can HR Combat Workplace Bullying?

HR Daily Advisor

Though fear and intimidation are counter-productive, some bullies rely on both to get the job done, whether that job is managing a department or running the company. Evaluating data (e.g., turnover, benefit costs, recruiting/retention success, productivity, workplace illness, and accidents) for signs of inappropriate behavior.

Insiders

Sign Up for our Newsletter

This site is protected by reCAPTCHA and the Google Privacy Policy and Terms of Service apply.

article thumbnail

The Top 5 Factors That Influence Employees’ Intent to Stay

Newmeasures

Retention became a focal part of the employee experience conversation last year and it has remained top of mind throughout 2023. We asked over 46,000 employees why they plan to stay with or leave their organizations in 2022 to help guide us in making decisions about retention in 2023. Why Do They Stay? Keep them going!

article thumbnail

19 Best Employee Engagement KPI You Need To Know In 2022

Vantage Circle

Improves employee retention. Gives clear, measurable improvement data. The Net Promoter Score is a metric developed in 1993 by Fred Reichheld and later adopted in 2003 by Bain & Company and Satmetrix to predict customer satisfaction and referral. Turnover Rate. Productivity Rate Of Employees. Employee NPS.

article thumbnail

19 eNPS Questions To Ask in Your Next eNPS Survey

Analytics in HR

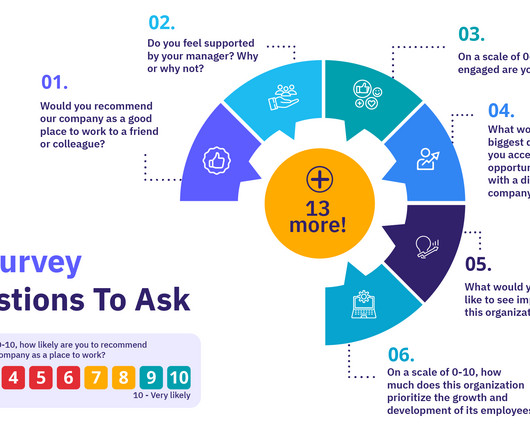
Employee engagement has been shown to impact business performance , including absenteeism, retention, and quality of work. Let’s explore these below: Rating questions: These questions typically have an answering scale of 0-5 or 0-10 and help to gather quantitative data about your employee’s experience. This provides quantitative data.

Survey 91
article thumbnail

Tableau For Human Resource Analytics

U-Next

Humans are complex creatures; we have emotions and feelings analyzed through visual data. Tableau is a powerful tool for creating and analyzing data, but it also can visualize information in a way that makes it easy for humans to understand their emotions, personalities, and motivations. Introduction . What Is Tableau? .

article thumbnail

Getting People Analytics Right: Josh Bersin Shares the Right Approach and Tools

Linkedin Talent Blog

A recent report from Deloitte found that 71% of companies view people analytics — the practice of collecting, cleaning, and interpreting data about employees to make better business decisions — as a high priority at their organization. Before you get started with analytics, make sure you have quality data. Sometimes there’s data.