Remove 2011 Remove Benchmarking Remove Data Remove Retention and Turnover
article thumbnail

People Analytics and HR-Tech Reading List

Littal Shemer

If you are interested in additional free resources for data science and R programming, check the comment section of this post. “Technology, data analytics, and artificial intelligence already impact how people work and engage with organizations. Click titles for Kindle versions (Work in progress. First published: May 14th, 2018.

article thumbnail

View from the HR Tech Show Floor: Top 5 Workforce Trends

Visier

Remembering our first HR Tech back in 2011, and reflecting on the show this year, the first thing that strikes you is how much the Expo floor has changed because of mergers and acquisitions. They are varied, but we are seeing HR focus on critical areas such as retention, recruiting, diversity requirements, and generational divides.

Trends 150
Insiders

Sign Up for our Newsletter

This site is protected by reCAPTCHA and the Google Privacy Policy and Terms of Service apply.

article thumbnail

What Is Employee Turnover (and Why It Matters)

Zenefits

At some point, if your business is more than one person, you’re likely to deal with employee turnover. In this article we walk the basics of employee turnover, including how to calculate it, industry benchmarks, and how we can use turnover rates to better understand business or economies at large. percent in 2010.

article thumbnail

iCIMS - Technology for Induction - and ensuring Quality of Hire ~ HR.

Strategic HCM

23 HR Most Influential UK Thinker 2011. The high first year turnover experienced in many, many organisations isn’t usually down to poor selection, it’s about everything else that’s going on instead. Induction Reports: Measure global metrics on HR productivity and key performance benchmarks. ► 2011.

article thumbnail

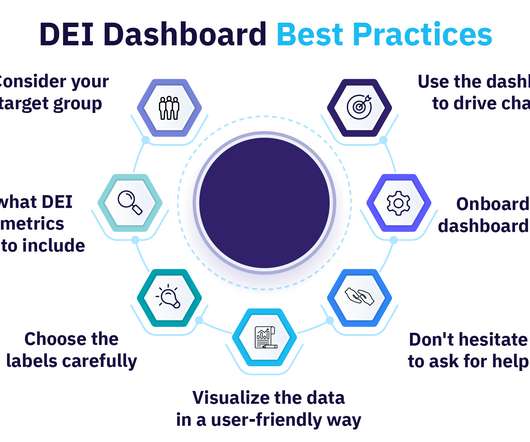
How to Create a DEI Dashboard for Your Organization in 7 Steps

Analytics in HR

For example, a DEI dashboard can show you the status of your workforce in areas including: gender, age, race and ethnicity, salary data, retention rates, neurodiversity, and more. Data is presented through various graphs, charts, and other visuals that are simple to understand and can be viewed at a glance.

article thumbnail

45+ Employee Experience Terms you have to know

Analytics in HR

This belief is based on, among other things, research conducted by Starbucks in 2011, which AnalitiQs repeated for a retail organization, with similar results. Insights that come from analyzing data and can be immediately translated into action. Data-driven. Data-driven is a way of working. Let’s dive into the findings!