This site uses cookies to improve your experience. To help us insure we adhere to various privacy regulations, please select your country/region of residence. If you do not select a country, we will assume you are from the United States. Select your Cookie Settings or view our Privacy Policy and Terms of Use.
Cookie Settings
Cookies and similar technologies are used on this website for proper function of the website, for tracking performance analytics and for marketing purposes. We and some of our third-party providers may use cookie data for various purposes. Please review the cookie settings below and choose your preference.
Used for the proper function of the website
Used for monitoring website traffic and interactions
Cookie Settings
Cookies and similar technologies are used on this website for proper function of the website, for tracking performance analytics and for marketing purposes. We and some of our third-party providers may use cookie data for various purposes. Please review the cookie settings below and choose your preference.
Strictly Necessary: Used for the proper function of the website
Performance/Analytics: Used for monitoring website traffic and interactions
HR KPI examples HR KPIs vs metrics Characteristics of good HR KPIs Leading vs. lagging KPIs HR KPIs case study HR KPI template HR KPI best practices FAQ What are HR KPIs? Human Resources key performance indicators (HR KPIs) are strategic HR metrics used to assess how effectively HR supports the organization’s overall goals.
By translating their objectives into clear, measurable metrics, HR teams can demonstrate the value of their work in a way any leader can understand. Turning the seemingly unquantifiable—like alignment and employee satisfaction—into clear metrics. Not all HR impacts can be captured in metrics. The first step?
Recruitment Timelines The urgency of hiring needs can also affect pricing: Standard Timelines : Aligning recruitment with typical time-to-fill benchmarks is usually cost-effective. Expedited Hiring : Tight deadlines may require more resources, such as overtime work or prioritization, leading to higher costs.
Step 5: Offer Management & Onboarding Support Once a candidate is selected, the RPO provider plays a crucial role in finalizing the hiring process. They assist with offer negotiations, ensuring that compensation packages align with industry benchmarks and meet both employer and candidate expectations.
You can get all these details by conducting a thorough job analysis and a compensation benchmarking exercise, which will show you where the industry is, so you can decide whether to lead, lag, or follow what’s happening in the industry. Repeat the same feedback collection process 30, 60, and 90 days after hiring.
Every once in a while, I run across an article that talks about why organizations shouldn’t calculate cost per hire. Personally, I’m a big fan of the cost per hiremetric. According to SHRM, the average cost per hire in 2016 was $4,129. As a result, they will need to hire 10 employees. If you know how to use them.
However, even with a streamlined hiring process, theres always room for improvement. This is where benchmarkingmetrics for your recruiting funnel come into play. By measuring the right metrics at each stage of the funnel, you can make data-driven decisions that improve your overall recruitment strategy.
But sometimes having that much information at our fingertips can be disabling and intimidating if we aren’t sure which metrics are worth our attention for our specific company. And let’s say you do know which KPIs will serve you well…how do you then decide on appropriate benchmarks for each metric for your business?
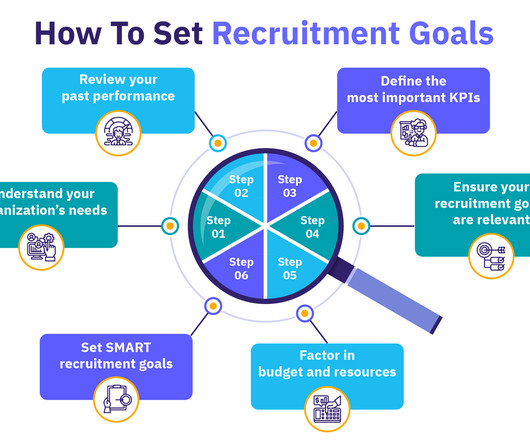
Quality of hire : Improve the quality of hires by assessing performance and cultural fit. Enjoy steady progress: Consistent goal setting and measurement of outcomes provide you with benchmarks to track progress, assess the effectiveness of your recruitment strategies , and tackle areas for improvement.
By personalizing your outreach, you can improve candidate engagement and build stronger relationships with potential hires. Use Data to Drive Decisions Direct sourcing generates a significant amount of data, including candidate profiles, engagement rates, and time-to-fill metrics.
Hiring costs are on the rise as companies compete to identify and acquire top talent. Here at nonprofit business-benchmarking organization APQC, we recently surveyed 552 companies from across the globe to learn how they’re approaching talent acquisition in this competitive landscape. Our findings are summarized below.
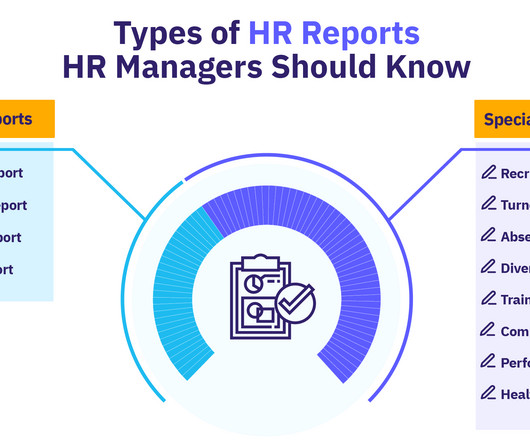
HR reports are strategic tools to showcase HR metrics and data, providing a detailed overview of your organization’s workforce and Human Resources activities. Key metrics to include are the total headcount, departmental breakdown, diversity metrics (e.g., Contents What is an HR report?
Outside of strategic time management, one of the easiest ways to put more time back in your day and get more done is to manage your daily, weekly, and monthly operations through the use of performance metrics. Recruitment Performance Metrics to Track. Applicant to hire conversion rate. Quality of hire.
Identifying, rinsing and repeating what’s working A striking feature of talent acquisition analytics is the ability to measure the success of your recruitment efforts with quantifiable metrics. A deeper dive into multiple data points is needed for analyzing elements such as channel effectiveness and quality of hires.
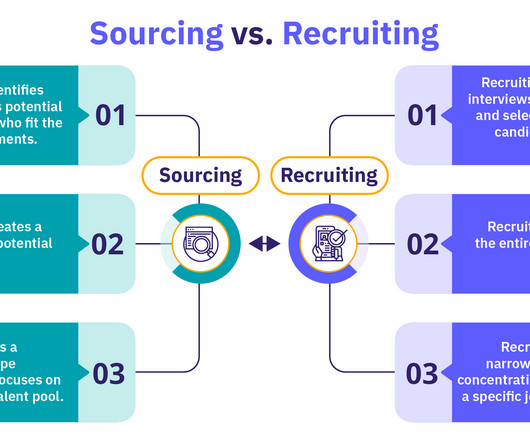
Sourcing decreases time and cost per hire while improving the hiringquality since these people are already pre-vetted. In the Employ’s Quarterly Insight’s report , benchmark data indicates that one-third of the time spent hiring is on sourcing, regardless of how fast the hiring process is.
By benchmarking best practices, we’ve been able to capture these skills in our new “Recruiter of the Future” competency model. The metric of success in this competency model isn’t jobs filled on time and at the lowest cost, but quality of hire and job satisfaction on the candidate’s first-year anniversary date, not their start date.
Using this limited lens, best practice for an organization’s direct cost-per-hire is approximately $1,500. There are a number of metrics that your organization should be tracking to ensure performance is meeting strategic expectations in addition to the financial needs of your organization. Quality of hire is essential.
Use metrics like candidate NPS (Net Promoter Score) to improve and automate feedback with Hoops’ tools—an essential part of a strong employer branding strategy. Measure ROI with Key Metrics → These KPIs prove what’s working—and help justify smart investments in talent. Quality of Hire: Target >85% first-year retention.
What’s a good benchmark for cost per hire? What’s a good benchmark for recruiting costs? What’s a good benchmark for a recruiting budget? What is cost per hire? Cost per hire is the average amount of money you spent on making a hire. What’s a good benchmark for cost per hire?
To truly evaluate the success of your hiring efforts, you need to track key recruitment metrics. Measuring Recruiting and Hiring Time to Fill and Close A straightforward yet vital metric, time to fill measures how long it takes to fill an open position from the moment it’s listed.
[link] Understanding the Metrics Behind Successful Recruitment Recruitment is a critical process for any organization, as it directly impacts the quality of talent that joins the team. In today’s competitive job market, it’s essential to have a deep understanding of the metrics that drive successful recruitment.
Training hiring managers on unconscious bias and ensuring a diverse interview panel are also steps I take. Moreover, I regularly review recruitment metrics to ensure we’re reaching a diverse candidate pool and making unbiased hiring decisions.” What metrics do you measure in recruitment analytics?
In this article, we explain the HR scorecard, discuss its benefits and common metrics, explain the difference between the HR scorecard and a balanced scorecard, and provide some examples of HR scorecards. It is a representation of leading HR indicators and key metrics that assesses the impact of HR activities on organizational performance.
Higher Quality of Hires With access to AI-powered screening tools and data-driven insights, recruiters can identify candidates who are the best fit for the role and company culture. This leads to better hiring decisions, higher retention rates, and improved overall workforce productivity.
According to industry findings, over 70% of large enterprises now use ai for recruitment to expedite hiring cycles and enhance diversity metrics. Smaller firms are also exploring AI-driven chatbots and automated shortlisting tools to reduce cost-per-hire. Leading adopters demonstrate tangible results.
These capabilities reduce administrative overhead by 40% and ensure new hires engage with relevant resources from day one. Recruitment leaders can monitor performance metrics in real time, iterating on models to align with business goals and evolving talent needs. Below are essential metrics for effective AI-driven recruitment.
So, hiring leaders internally can increase satisfaction and retention among whole teams. Improving the Quality of Hires Internal promotion also ensures that the people you hire for more advanced roles thoroughly understand the business. Track Key Metrics Maintain data on the rate of internal vs. external promotions.
Data-driven problem solvers who understand key SaaS metrics like MRR, churn rate and LTV. Salary benchmarking tools – Companies can now use tools, such as HR Datahub , that give them real-time data on what to pay for a role in order to be competitive. The best SaaS companies aim for under 30 days to avoid losing top candidates.
Analytics and Reporting Offers insights into recruitment metrics such as time-to-hire, cost-per-hire, and candidate source effectiveness. Data-Driven Decision Making Recruiters can leverage analytics to track performance, optimize strategies, and make informed hiring decisions.
What impact could faster, data-backed hiring decisions have on your quality of hires and retention rates? Could unexamined biases in AI tools be influencing your hiring outcomes? With these insights, recruiters can make faster, more confident decisions and reduce the chances of costly mis-hires.
These recruitment metrics help teams make choices to maximize their return on investment from specific decisions and measure the overall impacts over time. The platform’s thoughtfully designed home screen gives users easy access to key metrics.
By tracking key metrics such as time-to-hire, cost-per-hire, and quality of hire, recruitment managers can identify bottlenecks in the process, optimize recruitment channels, and make informed decisions. It provides them with a wealth of information that can be used to measure and improve recruitment strategies.
Can AI solve your hiring challenges? AI use in hiring is on the rise. The 2024-2025 Criteria HiringBenchmarking Report noted that about a quarter of companies are now using AI for hiring or talent management, a notable increase from the 12% that reported recruitment AI usage in the 2023 report.
Key Features: Talent Matching Engine : Uses contextual AI to match candidates and employees to roles based on skills, experience, and potential—reducing bias and improving quality of hire. Skills Gap Analysis : Maps workforce skills against future business needs to inform hiring and learning strategies.
Therefore, you need to keep the information on these sites updated and optimized to maintain the quality of hire despite the most volatile job markets. They have relevant industry skills and expertise to fulfill the latest job expectations, improving your quality of hire.
It’s a metric that can send shivers down any HR professional’s spine. It’s a complementary metric that places the emphasis on a positive perspective on employee satisfaction and loyalty. Retail organizations that experience seasonal hiring and attrition within hourly employee populations. Employee turnover.
This is where recruiting metrics come into play. Recruitment metrics provide highly valued data points that will guide you in determining the best channels, saving more on resources, and ultimately boosting outcomes. Let’s take it from the basics to spot the key metrics you need to follow and why.
Benchmark your job postings to industry standards and competitors to ensure competitiveness. Analyzing Recruitment Metrics for effective and consistent job descriptions Next, look at your recruitment metrics. Collect feedback from managers and current employees to identify areas for improvement.
Decoding HR KPIs: A Practical Guide to Core Analytics Metrics In 2025, human resource leaders must demonstrate their value with hard data instead of stories. Key performance indicators—those carefully chosen metrics that distill oceans of HR data into crisp signals you can act on. The common thread? The common thread? Explainable.
Tracks engagement metrics to improve outreach strategies. Workforce Insights & Analytics: Analyzes industry trends, competitor talent pools, and market benchmarks. Diversity-Focused: Advanced filters and metrics make it a leader in inclusive hiring. Provides actionable insights for strategic workforce planning.
Biases may continue to abound, companies may lack the DEIB metrics needed to secure investor interests, and recruitment could fail to tap fully into a diverse workforce. The good news is that benchmarking real-world case studies offers a realistic perspective to navigate the tricky and unpredictable DEIB journey. McKinsey & Co.’s
Sourcing tool Multiple job boards Texting Scheduling Survey Analytics/Dashboarding Tool Employer of Record What data’s important here: Building on new metrics, companies above 10,000+ are starting to look more closely at the following metrics: Internal mobility rate Definition: The percentage of hires coming from within the organization.
Track these metrics to assess your referral programs effectiveness: Referral quality rate This is the percentage of referred candidates who pass the initial screening. Look at the performance ratings of referred hires vs. other sources. You can also benchmark retention rates at the 6-month and 1-year marks.
We organize all of the trending information in your field so you don't have to. Join 318,000+ users and stay up to date on the latest articles your peers are reading.
You know about us, now we want to get to know you!
Let's personalize your content
Let's get even more personalized
We recognize your account from another site in our network, please click 'Send Email' below to continue with verifying your account and setting a password.


Let's personalize your content