This site uses cookies to improve your experience. To help us insure we adhere to various privacy regulations, please select your country/region of residence. If you do not select a country, we will assume you are from the United States. Select your Cookie Settings or view our Privacy Policy and Terms of Use.
Cookie Settings
Cookies and similar technologies are used on this website for proper function of the website, for tracking performance analytics and for marketing purposes. We and some of our third-party providers may use cookie data for various purposes. Please review the cookie settings below and choose your preference.
Used for the proper function of the website
Used for monitoring website traffic and interactions
Cookie Settings
Cookies and similar technologies are used on this website for proper function of the website, for tracking performance analytics and for marketing purposes. We and some of our third-party providers may use cookie data for various purposes. Please review the cookie settings below and choose your preference.
Strictly Necessary: Used for the proper function of the website
Performance/Analytics: Used for monitoring website traffic and interactions
The recently issued mandate, “Performance Management for Federal Employees,” requires agencies to “provide a firm benchmark towards which employees must aim their performance.” GPRA focuses on agency-level results, using metrics and data to monitor progress.
Beyond environmental concerns like carbon footprint reduction, organizations are addressing social metrics, such as diversity, equity, and inclusion , and governance factors like transparent decision-making and ethical leadership. Read more 13 ESG Metrics HR Leaders Should Use To Track Performance 5.
Figuring out how to successfully implement data-driven HR is a business challenge every company wanting to maintain or gain a competitive advantage will face in 2017. HR professionals are generally very good at reporting and benchmarking, but not as good at more sophisticated analytics.
Every year they release a Recruiting Benchmark Report offering a unique combination of data and guidance: summary and analysis of industry benchmark data, along with strategic advice to help you measure, improve and optimize every step of the recruiting funnel. Now onto my analysis form the report.
In this article, we will look at what the HR to employee ratio is, list factors that will influence this ratio, and give a benchmark of the HR to staff ratio. HR to employee ratio best practice Optimal HR to employee ratio benchmark. This metric provides a ratio that is indicative of the efficiency of HR.
Here are three metrics you can start tracking today: Quality of Hire Acquiring top talent is no simple task. The Quality of Hire metric is a quick index on a new hire’s adjustment, acclimation, and performance since joining the company. With data in hand, you can calculate your Quality of Hire metric.
Join us on May 11-12 in Las Vegas for current knowledge of the most efficient strategies, metrics, and benchmarks to grow your organization of the future at the THRIVE 2017 conference HR Agents of Change. The post Infographic: 5 Ways to Flip HR on its Head in 2017 appeared first on HR Daily Advisor.
As I mentioned earlier this week, I'm just coming off a couple of days at Recruiter Nation Live 2017 , a conference put on by the good folks at Jobvite. Unrelated to the show - I actually got an email on the way to #RNL17 - Jobvite recently published what they call the 2017 Recruiting Funnel Benchmark Report.
06/16/2017 // By tracy kelly // recruitment metrics. Here are the five job application metrics every recruiter needs to know to help improve the candidate experience. Monitor the number of applicants by position and department to set benchmarks and track application numbers over time. Number of Applicants.
7 Possible Human Capital Management Resolutions for 2017 Published date: January 3, 2017 Home. email facebook linkedin twitter google+ 2017 is upon us.After we’ve recovered from any holiday stupor it’ll be time to return our focus to future business. What can we do better in 2017? AND HERE ARE YOUR BLEEPING METRICS.
Top 5 Takeaways from the 2017 ASHHRA Conference Sep. The 2017 American Society for Healthcare Human Resources Administration (ASHHRA) Conference took place this past week in the Emerald City of Seattle, Washington. The following represent my top five takeaways from the 2017 ASHHRA Conference. Bryan-Barajas.jpg.
Tracking these metrics is key to developing an efficient and candidate-friendly hiring process. Hired’s Senior Internal Recruiter Jules Grondin says, “Determining which metric to look at more closely depends on what matters most to the company at that moment. weighed in on hiring metrics. You need to find the right balance.
This is all according to the 2017 Deloitte Global Human Capital Trends report, and these numbers are supported by dozens of other studies and surveys. Now is the time to test out those new processes on a limited scale to gather critical benchmark measurements immediately. And with good reason. 96% say the processes are simpler.
This is all according to the 2017 Deloitte Global Human Capital Trends report, and these numbers are supported by dozens of other studies and surveys. Now is the time to test out those new processes on a limited scale to gather critical benchmark measurements immediately. And with good reason. 96% say the processes are simpler.
There are so many different metrics and acronyms, you’re forgiven if you don’t recognize this one. NPS may be the one metric you’ve never heard of that meets the speed and flexibility of the modern workforce. eNPS allows you to easily benchmark engagement across different segments, over time, and relative to competitors.
From CultureNext: Technology and Metrics Overlooked in Recognition Programs — In this article from SHRM, the key highlights of the recent CultureNext Employee Engagement and Recognition Benchmark Study are revealed in context with what the data means for leaders taking charge of engagement. . CultureNext (@culturenxt) July 19, 2017.
What recruiting metrics should you be measuring, and how can you effectively gather the needed information? There are dozens of popular recruiting metrics, including the venerable Cost per Hire and Time to Fill. Source of Applicants versus Source Quality. What makes a qualified applicant? Time to Fill versus Source to Close.
On the product side of the business, we made several updates to the Hireology platform in 2017, including the following: Payroll and Talent Management Integration. Hireology Insights offers easy-to-understand reporting that provides clear visibility into hiring metrics, highlighting points of strength and weakness in the hiring process.
Just as important, we want to share benchmarks with you in the soonest possible way. Founded in 2013, Kazoo grows company culture and improves bottom-line performance metrics through its robust engagement platform that delivers recognition, rewards, incentives, and team insights. Measuring the Employee Experience.
Courses range from top-level analytics knowledge, to actually doing analytics, basic statistical knowledge, HR data and metrics, and more. R goes further than the traditional tools that are used for HR data benchmarking and analysis, like Microsoft Excel, Access, and SPSS. 11: Strategic HR Metrics – AIHR Academy. Conclusion.
April 20, 2017. April 19, 2017. April 20, 2017. April 20, 2017. April 20, 2017. The ERE Talent Manager survey is always great for benchmarking performance against your peers, but this season's installment had an eyebrow-raising revelation. April 20, 2017. ERE17 #TheCandEs — Kevin W. Third stat here.
That’s a key reason we’re seeing more healthcare customers try to do more with data in Workday—often combining financial and workforce information with key operational metrics, satisfaction scores, or benchmarks to see what insights they can glean in order to make more timely, confident decisions. 7653 at HIMSS 2017 , Feb.
With the release of Service Performance Insight’s “2017 Professional Services Maturity Benchmark,” it’s clear the professional services industry continues to face challenges. Here are three ways that leading professional services firms are moving their organizations forward, as highlighted in SPI’s 2017benchmark study: .
A group of best-performing companies has achieved a $2,251 per employee per year (PEPY) healthcare cost advantage over the national average in 2017 ($9,950 compared with $12,201), according to global advisory, broking, and solutions company Willis Towers Watson’s 22nd annual Best Practices in Health Care Employer Survey. About the Survey.
ExitRight ® recently updated its ExitRight norms based upon responses to benchmarked questions from all clients during 2016 and 2017. Here are 2017’s top five employer influenced turnover causes across all industries, pulled from a list of 12 reasons. The post Top Five Turnover Causes appeared first on HSD Metrics.
ExitRight ® recently updated its ExitRight norms based upon responses to benchmarked questions from all clients during 2016 and 2017. Here are 2017’s top five employer influenced turnover causes across all industries, pulled from a list of 12 reasons. The post Top Five Turnover Causes appeared first on HSD Metrics.
Hireology Customer Success Metrics. In 2018, Hireology customers have seen great success with hiring, including the following key metrics: 2018 Product Updates. Insights Benchmarks. This year, we made an update to the platform to make our Insights benchmarks even more accurate.
While this is a question best answered in the context of your unique talent strategy -- what it will take to execute that strategy to drive organization success and what role HR plays in making that happen -- benchmarks can sometimes provide a helpful reference point. HR employees in 2017. HR Budgets.
Absenteeism in this German 43,000 + people energy company has risen above benchmark. the UK retail business has systematically out-performed internal targets and external benchmarks, year on year. Business performance would increase if these three metrics would go up. Sick days at E.ON. People analytics also helped E.ON
And content will be an even bigger focus for hiring in 2018, as both Facebook and Google became key players in the jobs market in 2017. Since the shift from paper to online job applications, job description and career site content has been key to attracting quality candidates. and Canada directly in the platform.
Recently, the team shared with me the results of the 2017 Workday Value Index , a benchmarking and maturity assessment study. Managers are also able to focus on attracting, developing, and retaining the best talent, as evidenced by several key value metrics where high performers shine.
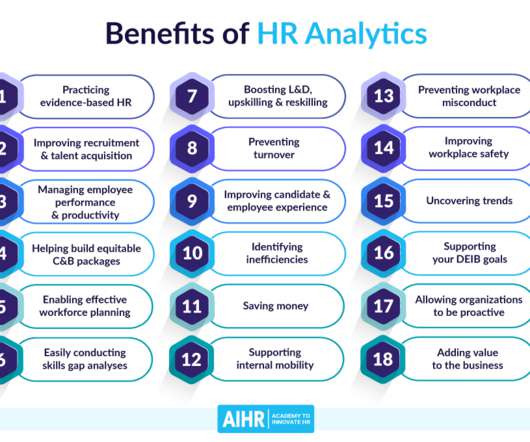
HR analytics involves collecting data and key metrics on your workforce and organization to gain valuable insights and better understand their effectiveness. Another example is when Kraft Heinz launched a hostile takeover bid of Unilever in 2017. Supporting your DEIB goals 17. Allowing organizations to be proactive 18.
Top Pain Points Felt by Today’s Communicators Source: 2017 Survey by SocialChorus & And Then Communications. By generating metrics corresponding to your goals. McIntosh suggests setting benchmark questions and tracking their progress to generate numbers you can present to senior leadership. Be an analyst.
Deloitte’s 2017 Global Human Capital Trends report pointed to “The Employee Experience: Culture, Engagement, and Beyond” as a top trend. Bersin’s Predictions for 2017 reported, “the topics of culture and engagement will continue to be top priorities, and we can now measure them closely.”.
10/26/2017 // By Deanna Kane // HIRING EVENTS. Position your recruiting team for hiring event success by measuring key metrics throughout the lifecycle of a career fair, ensuring every team member is prepared and establishing a measurable candidate communication plan. Event Metrics. Focus on a measurable metric (i.e.
For example, Dr. Jac Fitz-enz , whose founding of Saratoga Institute in 1980 put HR benchmarking on the map, suggests a framework that considers external and internal forces across organizational, human, relational, and structural capital. Patti Phillips, Ph.D.,
But every employer is at a different point in their data journey; some we work with have very little or even no people data to draw on at all, while others use a balanced scorecard to identify their financial, internal, customer, learning and growth metrics. What is the specific cost of excessive levels of stress on employees?
Hireology Customer Success Metrics. During the second quarter of 2019, Hireology customers saw continued success with hiring, including the following key metrics: Q2 2019 Product Updates. And in 2018, we made an update to the platform to make our Insights benchmarks even more accurate.
Then, the anonymized, aggregated data will be provided back to customers as useful metrics and trends representative of our collective customer community. How will customers participate in the benchmarking service? Customers aren’t satisfied with the current options they have for benchmark data.
In the SHRM Talent Acquisition Benchmarking Report from 2017 , the average time-to-fill out of the 864 samples analyzed was 36 days. The screening that manually took hours and hours is automated, meaning the person in charge of hiring reduces their time-to-fill, without reducing their quality of hire metric.
annual overall turnover rate in 2017, according to Gallup.com, which indicates this issue affects multiple industries. NetSuite is a Frequent salary benchmarking tool that uses industry and regional data to make offers more appealing and helps mitigate currency losses caused by inflation or market changes.
With the release of Service Performance Insight’s “2016 Professional Services Maturity Benchmark” report last year, it was clear that the professional services industry is at an inflection point, with many key indicators on the decline. It’s also important to make sure targets are going to meet short- and long-term objectives.
With 2017 drawing to a close, we wanted to highlight LinkedIn’s top 10 product updates from this year—from search filters that help you find open candidates, to a brand new way to connect LinkedIn Recruiter to your ATS. To receive blog posts like this one straight in your inbox, subscribe to the blog newsletter.
This percentage drops to 15% if you consider the metrics worldwide. A 2017 report by Gallup shows that 51% of workers are planning to leave their current jobs. You need to collect data to understand your efforts, weak areas, and a benchmark for the future. Which metrics will you use? Higher Retention.
We organize all of the trending information in your field so you don't have to. Join 318,000+ users and stay up to date on the latest articles your peers are reading.
You know about us, now we want to get to know you!
Let's personalize your content
Let's get even more personalized
We recognize your account from another site in our network, please click 'Send Email' below to continue with verifying your account and setting a password.


Let's personalize your content